Sysco 2011 Annual Report Download - page 59
Download and view the complete annual report
Please find page 59 of the 2011 Sysco annual report below. You can navigate through the pages in the report by either clicking on the pages listed below, or by using the keyword search tool below to find specific information within the annual report.-
 1
1 -
2
-
3
-
4
-
5
-
6
-
7
-
8
-
9
-
10
-
11
-
12
-
13
-
14
-
15
-
16
-
17
-
18
-
19
-
20
-
21
-
22
-
23
-
24
-
25
-
26
-
27
-
28
-
29
-
30
-
31
-
32
-
33
-
34
-
35
-
36
-
37
-
38
-
39
-
40
-
41
-
42
-
43
-
44
-
45
-
46
-
47
-
48
-
 49
49 -
 50
50 -
 51
51 -
 52
52 -
 53
53 -
 54
54 -
 55
55 -
 56
56 -
 57
57 -
 58
58 -
 59
59 -
 60
60 -
 61
61 -
 62
62 -
 63
63 -
 64
64 -
 65
65 -
 66
66 -
 67
67 -
 68
68 -
 69
69 -
70
-
71
-
72
-
73
-
74
-
75
-
76
-
77
-
78
-
79
-
80
-
81
-
82
-
83
-
84
-
85
-
86
-
87
-
88
-
89
-
90
-
91
-
92
-
93
-
94
-
95
-
96
-
97
-
98
-
99
-
100
-
101
-
102
-
103
-
104
-
105
 |
 |

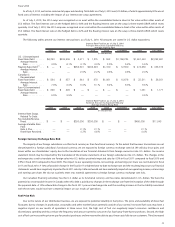
Fiscal 2010
As of July 3, 2010, we had no commercial paper outstanding. Total debt as of July 3, 2010 was $2.5 billion, of which approximately 81% was at
fixed rates of interest including the impact of our interest rate swap agreements.
As of July 3, 2010, the 2014 swap was recognized as an asset within the consolidated balance sheet at fair value within other assets of
$5.5 million. The fixed interest rate on the hedged debt is 4.6% and the floating interest rate on the swap is three-month LIBOR which resets
quarterly. As of July 3, 2010, the 2013 swap was recognized as an asset within the consolidated balance sheet at fair value within other assets of
$5.5 million. The fixed interest rate on the hedged debt is 4.2% and the floating interest rate on the swap is three-month LIBOR which resets
quarterly.
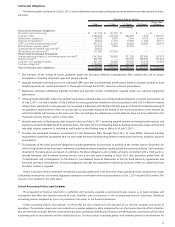
The following tables present our interest rate positions as of July 3, 2010. All amounts are stated in U.S. dollar equivalents.
2011 2012 2013 2014 2015 Thereafter Total Fair Value
Interest Rate Position as of July 3, 2010
Principal Amount by Expected Maturity
Average Interest Rate
(In thousands)
U.S. $ Denominated:
Fixed Rate Debt ...... $6,250 $204,658 $ 2,471 $ 1,275 $ 552 $1,766,234 $1,981,440 $2,262,961
Average Interest
Rate............ 4.5% 6.1% 4.7% 4.0% 3.5% 5.8% 5.9%
Floating Rate Debt
(1)
... $ — $ — $252,801 $208,249 $1,100 $ 12,500 $ 474,650 $ 483,872
Average Interest
Rate............ — — 2.5% 2.2% 0.3% 0.6% 2.3%
Canadian $
Denominated:
Fixed Rate Debt ...... $ 894 $ 957 $ 944 $ 979 $1,061 $ 18,676 $ 23,511 $ 26,851
Average Interest
Rate............ 7.6% 8.0% 8.8% 9.1% 9.2% 9.8% 9.5%
Euro eDenominated:
Fixed Rate Debt ...... $ 826 $ 205 $ — $ — $ — $ — $ 1,031 $ 1,177
Average Interest
Rate............ 8.9% 8.9% — — — — 8.9%
2011 2012 2013 2014 2015 Thereafter Total Fair Value
Interest Rate Position as of July 3, 2010
Notional Amount by Expected Maturity
Average Interest Swap Rate
(In thousands)
Interest Rate Swaps
Related To Debt:
Pay Variable/Receive
Fixed ............. $ — $ — $250,000 $200,000 $ — $ — $450,000 $11,045
Average Variable Rate
Paid:
Rate A Plus . ....... — — 2.1% 2.1% — — 2.1%
Fixed Rate Received . . — — 4.2% 4.6% — — 4.4%
Foreign Currency Exchange Rate Risk
The majority of our foreign subsidiaries use their local currency as their functional currency. To the extent that business transactions are not
denominated in a foreign subsidiary’s functional currency, we are exposed to foreign currency exchange rate risk. We will also incur gains and
losses within our shareholders’ equity due to the translation of our financial statements from foreign currencies into U.S. dollars. Our income
statement trends may be impacted by the translation of the income statements of our foreign subsidiaries into U.S. dollars. The changes in the
exchange rates used to translate our foreign sales into U.S. dollars positively impacted sales by 0.5% in fiscal 2011 compared to fiscal 2010 and
0.9% in fiscal 2010 compared to fiscal 2009. The impact to our operating income, net earnings and earnings per share was not material in fiscal
2011 and fiscal 2010. A 10% unfavorable change in the fiscal 2011 weighted year-to-date exchange rate and the resulting impact on our financial
statements would have negatively impacted fiscal 2011 sales by 0.6% and would not have materially impacted our operating income, net earnings
and earnings per share. We do not routinely enter into material agreements to hedge foreign currency exchange rate risks.
Our Canadian financing subsidiary has the U.S. dollar as its functional currency and has notes denominated in U.S. dollars. We have the
potential to create taxable income in Canada when this debt is paid due to changes in the exchange rate from the inception of the debt through
the payment date. A 10% unfavorable change in the fiscal 2011 year-end exchange rate and the resulting increase in the tax liability associated
with these notes would not have a material impact on our results of operations.
Fuel Price Risk
Due to the nature of our distribution business, we are exposed to potential volatility in fuel prices. The price and availability of diesel fuel
fluctuates due to changes in production, seasonality and other market factors generally outside of our control. Increased fuel costs may have a
negative impact on our results of operations in three areas. First, the high cost of fuel can negatively impact consumer confidence and
discretionary spending and thus reduce the frequency and amount spent by consumers for food-away-from-home purchases. Second, the high
cost of fuel can increase the price we pay for product purchases and we may not be able to pass these costs fully to our customers. Third, increased
35