Sysco 2011 Annual Report Download - page 44
Download and view the complete annual report
Please find page 44 of the 2011 Sysco annual report below. You can navigate through the pages in the report by either clicking on the pages listed below, or by using the keyword search tool below to find specific information within the annual report.-
 1
1 -
2
-
3
-
4
-
5
-
6
-
7
-
8
-
9
-
10
-
11
-
12
-
13
-
14
-
15
-
16
-
17
-
18
-
19
-
20
-
21
-
22
-
23
-
24
-
25
-
26
-
27
-
28
-
29
-
30
-
31
-
32
-
33
-
 34
34 -
 35
35 -
 36
36 -
 37
37 -
 38
38 -
 39
39 -
 40
40 -
 41
41 -
 42
42 -
 43
43 -
 44
44 -
 45
45 -
 46
46 -
 47
47 -
 48
48 -
 49
49 -
 50
50 -
 51
51 -
 52
52 -
 53
53 -
 54
54 -
55
-
56
-
57
-
58
-
59
-
60
-
61
-
62
-
63
-
64
-
65
-
66
-
67
-
68
-
69
-
70
-
71
-
72
-
73
-
74
-
75
-
76
-
77
-
78
-
79
-
80
-
81
-
82
-
83
-
84
-
85
-
86
-
87
-
88
-
89
-
90
-
91
-
92
-
93
-
94
-
95
-
96
-
97
-
98
-
99
-
100
-
101
-
102
-
103
-
104
-
105
 |
 |

the period by $16.8 million. The effective tax rate for fiscal 2009 was favorably impacted by the reversal of valuation allowances of $7.8 million
previously recorded on Canadian net operating loss deferred tax assets.
Earnings Per Share
Basic and diluted earnings per share decreased 1.5% in fiscal 2011 from the prior year. After adjusting for the estimated impact of the 53
rd
week in fiscal 2010, earnings per share increased 0.5%. This adjusted increase was primarily the result of factors discussed above, as well as a net
reduction in shares outstanding. The net reduction in both average and diluted shares outstanding was primarily due to share repurchases which
occurred during the first 26 weeks of fiscal 2011.
Basic earnings per share and diluted earnings per share increased 12.4% in fiscal 2010 from the prior year. After adjusting for the estimated
impact of the 53
rd
week in fiscal 2010, this increase would have been 10.2%. This adjusted increase was primarily the result of factors discussed
above, as well as a net reduction in shares outstanding. The net reduction in average shares outstanding was primarily due to share repurchases.
The net reduction in diluted shares outstanding was primarily due to share repurchases and an increase in the number of anti-dilutive options
excluded from the diluted shares calculation.
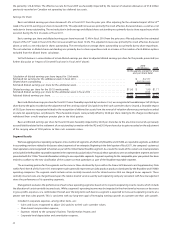
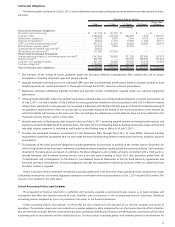
Set forth below is a reconciliation of actual diluted earnings per share to adjusted diluted earnings per share for the periods presented (see
further discussion at “Impact of 53-week fiscal year in Fiscal 2010” above):
2011
2010
(53 Weeks) 2009
(In thousands, except for share
and per share data)
Calculation of diluted earnings per share impact for 53rd week:
Estimated net earnings for the additional week in fiscal 2010 .................................... $ 24,127
Diluted shares outstanding ............................................................. 593,590,042
Estimated diluted earnings per share for the additional week .................................... $ 0.04
Diluted earnings per share for the 53/52 week periods . . . ...................................... $1.96 $ 1.99 $1.77
Estimated diluted earnings per share for the additional week in fiscal 2010 ......................... — 0.04 —
Adjusted diluted earnings per share ....................................................... $1.96 $ 1.95 $1.77
Basic and diluted earnings per share for fiscal 2011 were favorably impacted by two items. First, we recognized a favorable impact of $0.05 per
share due to the gains recorded on the adjustment of the carrying value of COLI policies to their cash surrender values. Second, a favorable impact
of $0.02 per share was recognized related to the recognition of deferred tax assets from the reversal of valuation allowances previously recorded
on state net operating loss carryforwards. These favorable impacts were partially offset by $0.04 per share relating to the charge recorded upon
withdrawal from a multi-employer pension plan in the third quarter.
Basic and diluted earnings per share for fiscal 2010 were favorably impacted by $0.05 per share due to the one-time reversal of a previously
accrued liability related to the settlement of an outstanding tax matter with the IRS and $0.04 per share due to gains recorded on the adjustment
of the carrying value of COLI policies to their cash surrender values.
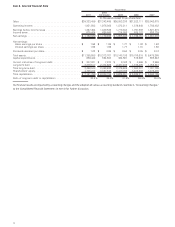
Segment Results
We have aggregated our operating companies into a number of segments, of which only Broadline and SYGMA are reportable segments as defined
in accounting provisions related to disclosures about segments of an enterprise. Beginning in the third quarter of fiscal 2011, the company’s custom-cut
meat operations were reorganized to function as part of the United States Broadline segment. As a result, the results of the custom-cut meat operations
areincludedintheBroadlinereportablesegmentinthesegmentdiscussionbelow.Previously,theseoperationswereanindependentsegmentandwere
presented with the “Other” financial information relating to non-reportable segments. Segment reporting for the comparable prior year periods has been
revised to conform to the new classification of the custom-cut meat operations as part of the Broadline reportable segment.
The accounting policies for the segments are the same as those disclosed by Sysco within the Financial Statements and Supplementary Data
within Part II Item 8 of this Form 10-K. Intersegment sales generally represent specialty produce products distributed by the Broadline and SYGMA
operating companies. The segment results include certain centrally incurred costs for shared services that are charged to our segments. These
centrally incurred costs are charged based upon the relative level of service used by each operating company consistent with how management
views the performance of its operating segments.
Management evaluates the performance of each of our operating segments based on its respective operating income results, which include
the allocation of certain centrally incurred costs. While a segment’s operating income may be impacted in the short term by increases or decreases
in gross profits, expenses, or a combination thereof, over the long-term each business segment is expected to increase its operating income at a
greater rate than sales growth. This is consistent with our long-term goal of leveraging earnings growth at a greater rate than sales growth.
Included in corporate expenses, among other items, are:
• Gains and losses recognized to adjust COLI policies to their cash surrender values;
• Share-based compensation expense;
• Expenses related to the company’s Business Transformation Project; and
• Corporate-level depreciation and amortization expense.
20