Sysco 2011 Annual Report Download - page 37
Download and view the complete annual report
Please find page 37 of the 2011 Sysco annual report below. You can navigate through the pages in the report by either clicking on the pages listed below, or by using the keyword search tool below to find specific information within the annual report.-
 1
1 -
2
-
3
-
4
-
5
-
6
-
7
-
8
-
9
-
10
-
11
-
12
-
13
-
14
-
15
-
16
-
17
-
18
-
19
-
20
-
21
-
22
-
23
-
24
-
25
-
26
-
 27
27 -
 28
28 -
 29
29 -
 30
30 -
 31
31 -
 32
32 -
 33
33 -
 34
34 -
 35
35 -
 36
36 -
 37
37 -
 38
38 -
 39
39 -
 40
40 -
 41
41 -
 42
42 -
 43
43 -
 44
44 -
 45
45 -
 46
46 -
 47
47 -
48
-
49
-
50
-
51
-
52
-
53
-
54
-
55
-
56
-
57
-
58
-
59
-
60
-
61
-
62
-
63
-
64
-
65
-
66
-
67
-
68
-
69
-
70
-
71
-
72
-
73
-
74
-
75
-
76
-
77
-
78
-
79
-
80
-
81
-
82
-
83
-
84
-
85
-
86
-
87
-
88
-
89
-
90
-
91
-
92
-
93
-
94
-
95
-
96
-
97
-
98
-
99
-
100
-
101
-
102
-
103
-
104
-
105
 |
 |

Item 7. Management’s Discussion and Analysis of Financial Condition and Results of Operations
Overview
Sysco distributes food and related products to restaurants, healthcare and educational facilities, lodging establishments and other
foodservice customers. Our operations are primarily located throughout the United States, Canada and Ireland and include broadline companies,
custom-cut meat operations, specialty produce companies, hotel supply operations, SYGMA (our chain restaurant distribution subsidiary) and a
company that distributes to international customers.
We consider our primary market to be the foodservice market in the United States and Canada and estimate that we serve about 17% of this
approximately $220 billion annual market. According to industry sources, the foodservice, or food-away-from-home, market represents
approximately 47% of the total dollars spent on food purchases made at the consumer level in the United States. This share grew from about
37% in 1972 to nearly 50% in 1998 and did not change materially until 2009 when it declined to the current level of 47%.
Industry sources estimate the total foodservice market in the United States experienced a real sales decline of approximately 0.8% in calendar
year 2010 and 6.9% in calendar year 2009. Real sales declines do not include the impact of inflation or deflation.
General economic conditions and consumer confidence can affect the frequency of purchases and amounts spent by consumers for food-
away-from-home and, in turn, can impact our customers and our sales. We believe the current general economic conditions, including pressure on
consumer disposable income, have contributed to a decline in the foodservice market. Historically, we have grown at a faster rate than the overall
industry and have grown our market share in this fragmented industry.
Highlights
A slow economic recovery in the United States, combined with rising product cost inflation and continued low levels of consumer
confidence, contributed to a challenging business environment in fiscal 2011. Sales increased during fiscal 2011 as compared to fiscal 2010;
however, gross profit dollars grew at a slower rate than sales and operating expenses increased faster than gross profit partially due to a significant
charge of $36.1 million from a withdrawal from a multi-employer pension plan. This resulted in a decline in operating income for fiscal 2011 as
compared to fiscal 2010. Comparisons between fiscal 2011 and fiscal 2010 are impacted by the presence of a 53
rd
week in fiscal 2010. Sysco’s fiscal
year ends on the Saturday nearest to June 30th. This resulted in a 52-week year ending July 2, 2011, a 53-week year ending July 3, 2010 for fiscal
2010 and a 52-week year ending June 27, 2009. Our Results of Operations discussion includes reconciliations of the actual results for fiscal 2010 to
the adjusted results for fiscal 2010 based on a 52-week fiscal year due to the impact of the 53-week year in fiscal 2010.
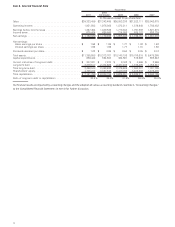
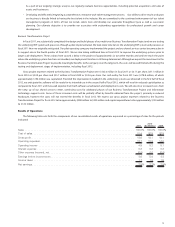
The following table sets forth the change in certain components of our consolidated results of operations expressed as a percentage increase
or decrease over Fiscal 2010 on both a 53-week basis, or GAAP basis, and an adjusted 52-week basis:
Increase /
(Decrease)
on a GAAP Basis
Increase /
(Decrease) on an
Adjusted Basis
Sales . . . .............................................................. 5.6% 7.7%
Operating income ........................................................ (2.2) (0.1)
Net earnings ............................................................ (2.4) (0.3)
Basic earnings per share . ................................................... (1.5) 0.5
Diluted earnings per share................................................... (1.5) 0.5
• Sales were $39.3 billion in fiscal 2011, an increase of 5.6% from the comparable prior year period. After adjusting for the estimated impact
of the 53
rd
week, the increase would have been 7.7%. This adjusted increase was primarily due to increased prices from inflation and
improving case volumes. Inflation, as measured by changes in our product costs, was an estimated 4.6% during fiscal 2011. The exchange
rates used to translate our foreign sales into U.S. dollars positively impacted sales by 0.5% and sales from acquisitions within the last
12 months favorably impacted sales by 0.7%.
• Operating income was $1.9 billion, a 2.2% decrease from the prior year. After adjusting for the estimated impact of the 53
rd
week in fiscal
2010, this decrease would have been 0.1%. This adjusted decrease was primarily driven by gross profit dollars growing at a slower rate
than sales and operating expenses increasing faster than gross profit partially due to a significant charge of $36.1 million from a
withdrawal from a multi-employer pension plan. Gross profit dollars increased 3.0% in fiscal 2011 from the comparable prior year period
but declined as a percentage of sales. This result was primarily due to the impact of significant inflation in certain product categories and
strategic pricing initiatives. Operating expenses increased 5.0% primarily due to higher pay-related expense, an increase in net company-
sponsored pension costs, provisions for withdrawal from multi-employer pension plans and higher fuel costs as compared to the prior
year period. The impact of these factors on operating expenses was partially offset by a decrease in operating expenses resulting from the
absence of the 53
rd
week in fiscal 2011.
• Net earnings were $1.2 billion, an 2.4% decrease from the prior year. After adjusting for the estimated impact of the 53
rd
week in fiscal
2010, the decrease would have been 0.3%. This adjusted decrease was primarily due to the factors discussed above and an increase in the
effective tax rate. The effective tax rate for fiscal 2011 was 36.96%, compared to an effective tax rate of 36.20% for fiscal 2010. The
difference between the tax rates for the two periods resulted largely from the one-time reversal of interest accruals for tax contingencies
related to our settlement with the Internal Revenue Service (IRS) in the first quarter of fiscal 2010.
13