Sysco 2011 Annual Report Download - page 75
Download and view the complete annual report
Please find page 75 of the 2011 Sysco annual report below. You can navigate through the pages in the report by either clicking on the pages listed below, or by using the keyword search tool below to find specific information within the annual report.-
 1
1 -
2
-
3
-
4
-
5
-
6
-
7
-
8
-
9
-
10
-
11
-
12
-
13
-
14
-
15
-
16
-
17
-
18
-
19
-
20
-
21
-
22
-
23
-
24
-
25
-
26
-
27
-
28
-
29
-
30
-
31
-
32
-
33
-
34
-
35
-
36
-
37
-
38
-
39
-
40
-
41
-
42
-
43
-
44
-
45
-
46
-
47
-
48
-
49
-
50
-
51
-
52
-
53
-
54
-
55
-
56
-
57
-
58
-
59
-
60
-
61
-
62
-
63
-
64
-
 65
65 -
 66
66 -
 67
67 -
 68
68 -
 69
69 -
 70
70 -
 71
71 -
 72
72 -
 73
73 -
 74
74 -
 75
75 -
 76
76 -
 77
77 -
 78
78 -
 79
79 -
 80
80 -
 81
81 -
 82
82 -
 83
83 -
 84
84 -
 85
85 -
86
-
87
-
88
-
89
-
90
-
91
-
92
-
93
-
94
-
95
-
96
-
97
-
98
-
99
-
100
-
101
-
102
-
103
-
104
-
105
 |
 |

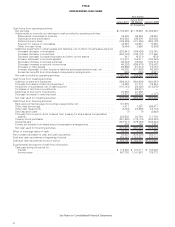
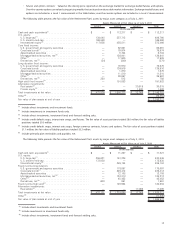
The capitalized direct costs for the internal use software portion of the company’s Business Transformation Project are included within
“computer hardware and software” in the table above in the amount of $356.2 million and $181.5 million as of July 2, 2011 and July 3, 2010,
respectively.
Depreciation expense, including capital leases, for the past three years was $374.0 million in 2011, $361.7 million in 2010 and $361.1 million in
2009.
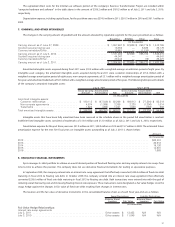
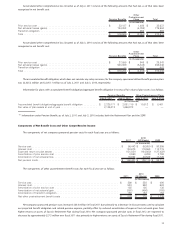
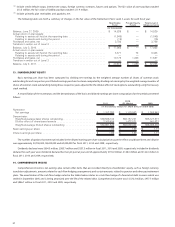
7. GOODWILL AND OTHER INTANGIBLES
The changes in the carrying amount of goodwill and the amount allocated by reportable segment for the years presented are as follows:
Broadline SYGMA Other Total
(In thousands)
Carrying amount as of June 27, 2009 ............................... $ 1,087,467 $ 32,609 $ 390,719 $ 1,510,795
Goodwill acquired during year .................................... 18,350 — 6,829 25,179
Currency translation/Other ....................................... 15,651 — (1,810) 13,841
Carrying amount as of July 3, 2010. . ............................... 1,121,468 32,609 395,738 1,549,815
Goodwill acquired during year .................................... 44,047 — — 44,047
Currency translation/Other ....................................... 39,442 — (15) 39,427
Carrying amount as of July 2, 2011. . ............................... $ 1,204,957 $ 32,609 $ 395,723 $ 1,633,289
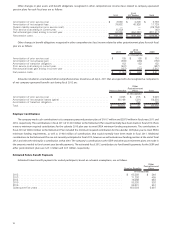
Amortized intangible assets acquired during fiscal 2011 were $19.2 million with a weighted-average amortization period of eight years. By
intangible asset category, the amortized intangible assets acquired during fiscal 2011 were customer relationships of $15.6 million with a
weighted-average amortization period of eight years, non-compete agreements of $3.1 million with a weighted-average amortization period of
five years and amortized trademarks of $0.5 million with a weighted-average amortization period of five years. The following table presents details
of the company’s amortized intangible assets:
Gross Carrying
Amount
Accumulated
Amortization Net
Gross Carrying
Amount
Accumulated
Amortization Net
July 2, 2011 July 3, 2010
(In thousands)
Amortized intangible assets:
Customer relationships . ................... $ 190,112 $ (97,846) $ 92,266 $ 169,913 $ (77,394) $ 92,519
Non-compete agreements .................. 4,574 (1,269) 3,305 2,320 (1,306) 1,014
Trademarks ............................ 1,623 (282) 1,341 1,038 (136) 902
Total amortized intangible assets ............... $ 196,309 $ (99,397) $ 96,912 $ 173,271 $ (78,836) $ 94,435
Intangible assets that have been fully amortized have been removed in the schedule above in the period full amortization is reached.
Indefinite-lived intangible assets consisted of trademarks of $13.0 million and $12.0 million as of July 2, 2011 and July 3, 2010, respectively.
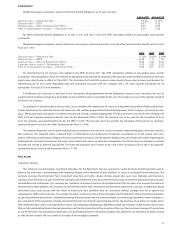
Amortization expense for the past three years was $21.9 million in 2011, $20.9 million in 2010 and $15.7 million in 2009. The estimated future
amortization expense for the next five fiscal years on intangible assets outstanding as of July 2, 2011 is shown below:
Amount
(In thousands)
2012 . . ............................................................................... $22,513
2013 . . ............................................................................... 20,518
2014 . . ............................................................................... 19,126
2015 . . ............................................................................... 14,501
2016 . . ............................................................................... 7,668
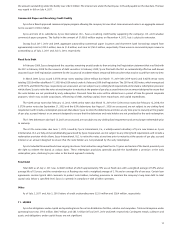
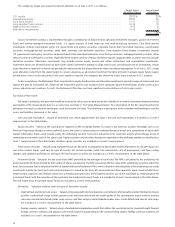
8. DERIVATIVE FINANCIAL INSTRUMENTS
Sysco manages its debt portfolio to achieve an overall desired position of fixed and floating rates and may employ interest rate swaps from
time to time to achieve this position. The company does not use derivative financial instruments for trading or speculative purposes.
In September 2009, the company entered into an interest rate swap agreement that effectively converted $200.0 million of fixed rate debt
maturing in fiscal 2014 to floating rate debt. In October 2009, the company entered into an interest rate swap agreement that effectively
converted $250.0 million of fixed rate debt maturing in fiscal 2013 to floating rate debt. Both transactions were entered into with the goal of
reducing overall borrowing cost and increasing floating interest rate exposure. These transactions were designated as fair value hedges since the
swaps hedge against the changes in fair value of fixed rate debt resulting from changes in interest rates.
The location and the fair value of derivative instruments in the consolidated balance sheet as of each fiscal year-end are as follows:
Balance Sheet
Location Fair Value
Balance Sheet
Location Fair Value
Asset Derivatives Liability Derivatives
(In thousands)
Fair Value Hedge Relationships:
Interest rate swap agreements
July 2, 2011 .............................................. Other assets $ 13,482 N/A N/A
July 3, 2010 .............................................. Other assets $ 11,045 N/A N/A
51