Sysco 2011 Annual Report Download - page 35
Download and view the complete annual report
Please find page 35 of the 2011 Sysco annual report below. You can navigate through the pages in the report by either clicking on the pages listed below, or by using the keyword search tool below to find specific information within the annual report.-
 1
1 -
2
-
3
-
4
-
5
-
6
-
7
-
8
-
9
-
10
-
11
-
12
-
13
-
14
-
15
-
16
-
17
-
18
-
19
-
20
-
21
-
22
-
23
-
24
-
 25
25 -
 26
26 -
 27
27 -
 28
28 -
 29
29 -
 30
30 -
 31
31 -
 32
32 -
 33
33 -
 34
34 -
 35
35 -
 36
36 -
 37
37 -
 38
38 -
 39
39 -
 40
40 -
 41
41 -
 42
42 -
 43
43 -
 44
44 -
 45
45 -
46
-
47
-
48
-
49
-
50
-
51
-
52
-
53
-
54
-
55
-
56
-
57
-
58
-
59
-
60
-
61
-
62
-
63
-
64
-
65
-
66
-
67
-
68
-
69
-
70
-
71
-
72
-
73
-
74
-
75
-
76
-
77
-
78
-
79
-
80
-
81
-
82
-
83
-
84
-
85
-
86
-
87
-
88
-
89
-
90
-
91
-
92
-
93
-
94
-
95
-
96
-
97
-
98
-
99
-
100
-
101
-
102
-
103
-
104
-
105
 |
 |
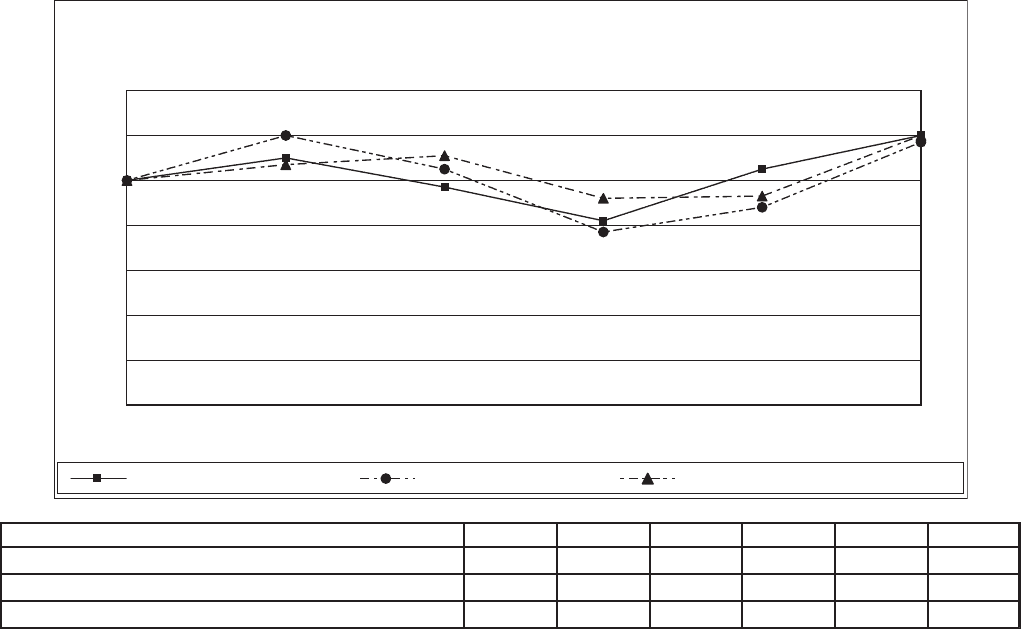
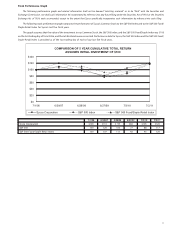
Stock Performance Graph
The following performance graph and related information shall not be deemed “soliciting material” or to be “filed” with the Securities and
Exchange Commission, nor shall such information be incorporated by reference into any future filing under the Securities Act of 1933 or the Securities
Exchange Act of 1934, each as amended, except to the extent that Sysco specifically incorporates such information by reference into such filing.
The following stock performance graph compares the performance of Sysco’s Common Stock to the S&P 500 Index and to the S&P 500 Food/
Staple Retail Index for Sysco’s last five fiscal years.
The graph assumes that the value of the investment in our Common Stock, the S&P 500 Index, and the S&P 500 Food/Staple Index was $100
on the last trading day of fiscal 2006, and that all dividends were reinvested. Performance data for Sysco, the S&P 500 Index and the S&P 500 Food/
Staple Retail Index is provided as of the last trading day of each of our last five fiscal years.
COMPARISON OF 5 YEAR CUMULATIVE TOTAL RETURN
ASSUMES INITIAL INVESTMENT OF $100
$0
$20
$40
$60
$80
$100
$120
$140
7/1/06 6/30/07 6/28/08 6/27/09 7/3/10 7/2/11
Sysco Corporation S&P 500 Index S&P 500 Food/Staple Retail Index
7/1/06 6/30/07 6/28/08 6/27/09 7/3/10 7/2/11
Sysco Corporation $100 $110 $ 97 $82 $105 $120
S&P 500 100 120 105 77 88 117
S&P 500 Food/Staple Retail Index 100 107 111 92 93 120
11