Sysco 2011 Annual Report Download - page 36
Download and view the complete annual report
Please find page 36 of the 2011 Sysco annual report below. You can navigate through the pages in the report by either clicking on the pages listed below, or by using the keyword search tool below to find specific information within the annual report.-
 1
1 -
2
-
3
-
4
-
5
-
6
-
7
-
8
-
9
-
10
-
11
-
12
-
13
-
14
-
15
-
16
-
17
-
18
-
19
-
20
-
21
-
22
-
23
-
24
-
25
-
 26
26 -
 27
27 -
 28
28 -
 29
29 -
 30
30 -
 31
31 -
 32
32 -
 33
33 -
 34
34 -
 35
35 -
 36
36 -
 37
37 -
 38
38 -
 39
39 -
 40
40 -
 41
41 -
 42
42 -
 43
43 -
 44
44 -
 45
45 -
 46
46 -
47
-
48
-
49
-
50
-
51
-
52
-
53
-
54
-
55
-
56
-
57
-
58
-
59
-
60
-
61
-
62
-
63
-
64
-
65
-
66
-
67
-
68
-
69
-
70
-
71
-
72
-
73
-
74
-
75
-
76
-
77
-
78
-
79
-
80
-
81
-
82
-
83
-
84
-
85
-
86
-
87
-
88
-
89
-
90
-
91
-
92
-
93
-
94
-
95
-
96
-
97
-
98
-
99
-
100
-
101
-
102
-
103
-
104
-
105
 |
 |

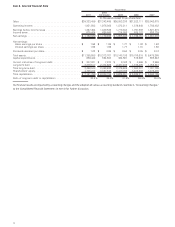
Item 6. Selected Financial Data
2011
2010
(53 Weeks) 2009 2008 2007
Fiscal Year
(In thousands except for per share data)
Sales ....................................... $39,323,489 $37,243,495 $36,853,330 $37,522,111 $35,042,075
Operating income............................... 1,931,502 1,975,868 1,872,211 1,879,949 1,708,482
Earnings before income taxes ...................... 1,827,454 1,849,589 1,770,834 1,791,338 1,621,215
Income taxes.................................. 675,424 669,606 714,886 685,187 620,139
Net earnings .................................. $ 1,152,030 $ 1,179,983 $ 1,055,948 $ 1,106,151 $ 1,001,076
Net earnings:
Basic earnings per share . ....................... $ 1.96 $ 1.99 $ 1.77 $ 1.83 $ 1.62
Diluted earnings per share ....................... 1.96 1.99 1.77 1.81 1.60
Dividends declared per share ....................... $ 1.03 $ 0.99 $ 0.94 $ 0.85 $ 0.74
Total assets . .................................. $11,385,555 $10,313,701 $10,148,186 $10,010,615 $ 9,475,365
Capital expenditures ............................. 636,442 594,604 464,561 515,963 603,242
Current maturities of long-term debt.................. $ 207,031 $ 7,970 $ 9,163 $ 4,896 $ 3,568
Long-term debt ................................ 2,279,517 2,472,662 2,467,486 1,975,435 1,758,227
Total long-term debt ............................. 2,486,548 2,480,632 2,476,649 1,980,331 1,761,795
Shareholders’ equity ............................. 4,705,242 3,827,526 3,449,702 3,408,986 3,278,400
Total capitalization .............................. $ 7,191,790 $ 6,308,158 $ 5,926,351 $ 5,389,317 $ 5,040,195
Ratio of long-term debt to capitalization . . . ............ 34.6% 39.3% 41.8% 36.8% 35.0%
Our financial results are impacted by accounting changes and the adoption of various accounting standards. See Note 2, “Accounting Changes,”
to the Consolidated Financial Statements in Item 8 for further discussion.
12