Sysco 2011 Annual Report Download - page 83
Download and view the complete annual report
Please find page 83 of the 2011 Sysco annual report below. You can navigate through the pages in the report by either clicking on the pages listed below, or by using the keyword search tool below to find specific information within the annual report.-
 1
1 -
2
-
3
-
4
-
5
-
6
-
7
-
8
-
9
-
10
-
11
-
12
-
13
-
14
-
15
-
16
-
17
-
18
-
19
-
20
-
21
-
22
-
23
-
24
-
25
-
26
-
27
-
28
-
29
-
30
-
31
-
32
-
33
-
34
-
35
-
36
-
37
-
38
-
39
-
40
-
41
-
42
-
43
-
44
-
45
-
46
-
47
-
48
-
49
-
50
-
51
-
52
-
53
-
54
-
55
-
56
-
57
-
58
-
59
-
60
-
61
-
62
-
63
-
64
-
65
-
66
-
67
-
68
-
69
-
70
-
71
-
72
-
 73
73 -
 74
74 -
 75
75 -
 76
76 -
 77
77 -
 78
78 -
 79
79 -
 80
80 -
 81
81 -
 82
82 -
 83
83 -
 84
84 -
 85
85 -
 86
86 -
 87
87 -
 88
88 -
 89
89 -
 90
90 -
 91
91 -
 92
92 -
 93
93 -
94
-
95
-
96
-
97
-
98
-
99
-
100
-
101
-
102
-
103
-
104
-
105
 |
 |

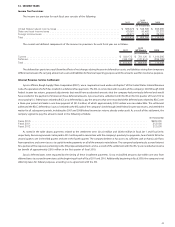
•Futures and option contracts: Valued at the closing price reported on the exchange market for exchange-traded futures and options.
Over-the-counter options are valued using pricing models that are based on observable market information. Exchange-traded futures and
options are included as a Level 1 measurement in the table below; over-the-counter options are included as a Level 2 measurement.
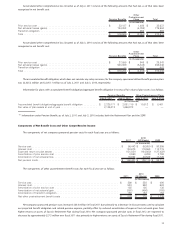
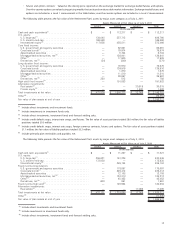
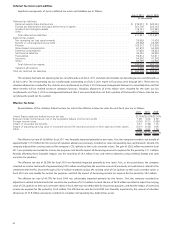
The following table presents the fair value of the Retirement Plan’s assets by major asset category as of July 2, 2011:
Level 1 Level 2 Level 3 Total
Assets Measured at Fair Value as of July 2, 2011
(In thousands)
Cash and cash equivalents
(1)
.......................... $ — $ 112,217 $ — $ 112,217
U.S. equity:
U.S. large-cap
(1)
................................. 139,048 357,712 — 496,760
U.S. small-to-mid-cap . . . .......................... 166,890 — — 166,890
International equity
(2)
............................. 117,655 455,811 — 573,466
Core fixed income:
U.S. government and agency securities . . .............. — 62,691 — 62,691
Corporate bonds
(1)
............................... — 79,974 — 79,974
Asset-backed securities . .......................... — 8,704 — 8,704
Mortgage-backed securities, net
(3)
.................... — 129,941 — 129,941
Other
(1)
....................................... — 17,905 — 17,905
Derivatives, net
(4)
................................ (34) (340) — (374)
Long duration fixed income:
U.S. government and agency securities . . .............. — 79,970 — 79,970
Corporate bonds ................................ — 139,916 — 139,916
Asset-backed securities . .......................... — 1,870 — 1,870
Mortgage-backed securities......................... — 11,810 — 11,810
Other
(1)
....................................... — 39,997 — 39,997
Derivatives, net
(5)
................................ 280 512 — 792
High yield fixed income
(2)
............................ — 191,583 — 191,583
Alternative investments:
Real estate
(2)
................................... — — 30,615 30,615
Private equity
(2)
................................. — — 1,480 1,480
Total investments at fair value......................... $ 423,839 $ 1,690,273 $ 32,095 $ 2,146,207
Other
(6)
........................................ (39,894)
Fair value of plan assets at end of year .................. $ 2,106,313
(1)
Include direct investments and investment funds.
(2)
Include investments in investment funds only.
(3)
Include direct investments, investment funds and forward settling sales.
(4)
Include credit default swaps, interest rate swaps, and futures. The fair value of asset positions totaled $8.6 million; the fair value of liability
positions totaled $9.0 million.
(5)
Include credit default swaps, interest rate swaps, foreign currency contracts, futures and options. The fair value of asset positions totaled
$1.1 million; the fair value of liability positions totaled $0.3 million.
(6)
Include primarily plan receivables and payables, net.
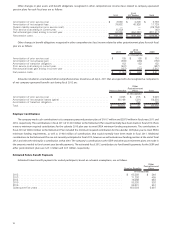
The following table presents the fair value of the Retirement Plan’s assets by major asset category as of July 3, 2010:
Level 1 Level 2 Level 3 Total
Assets Measured at Fair Value as of July 3, 2010
(In thousands)
Cash and cash equivalents
(1)
.......................... $ — $ 71,327 $ — $ 71,327
U.S. equity:
U.S. large-cap
(1)
................................. 259,621 161,228 — 420,849
U.S. small-to-mid-cap . . . .......................... 172,930 — — 172,930
International equity
(2)
............................. — 285,184 — 285,184
Fixed income long duration:
U.S. government and agency securities . . .............. — 178,097 — 178,097
Corporate bonds
(1)
............................... — 225,412 — 225,412
Asset-backed securities . .......................... — 12,108 — 12,108
Mortgage-backed securities, net
(3)
.................... — 124,312 — 124,312
Other
(1)
....................................... — 48,452 — 48,452
Derivatives, net
(4)
................................ 600 991 — 1,591
Fixed income high yield
(2)
............................ — 120,984 — 120,984
Alternative investments:
Real estate
(2)
................................... — — 17,065 17,065
Total investments at fair value......................... $ 433,151 $ 1,228,095 $ 17,065 $ 1,678,311
Other
(5)
........................................ (11,339)
Fair value of plan assets at end of year .................. $ 1,666,972
(1)
Include direct investments and investment funds.
(2)
Include investments in investment funds only.
(3)
Include direct investments, investment funds and forward settling sales.
59