Sysco 2011 Annual Report Download - page 65
Download and view the complete annual report
Please find page 65 of the 2011 Sysco annual report below. You can navigate through the pages in the report by either clicking on the pages listed below, or by using the keyword search tool below to find specific information within the annual report.-
 1
1 -
2
-
3
-
4
-
5
-
6
-
7
-
8
-
9
-
10
-
11
-
12
-
13
-
14
-
15
-
16
-
17
-
18
-
19
-
20
-
21
-
22
-
23
-
24
-
25
-
26
-
27
-
28
-
29
-
30
-
31
-
32
-
33
-
34
-
35
-
36
-
37
-
38
-
39
-
40
-
41
-
42
-
43
-
44
-
45
-
46
-
47
-
48
-
49
-
50
-
51
-
52
-
53
-
54
-
 55
55 -
 56
56 -
 57
57 -
 58
58 -
 59
59 -
 60
60 -
 61
61 -
 62
62 -
 63
63 -
 64
64 -
 65
65 -
 66
66 -
 67
67 -
 68
68 -
 69
69 -
 70
70 -
 71
71 -
 72
72 -
 73
73 -
 74
74 -
 75
75 -
76
-
77
-
78
-
79
-
80
-
81
-
82
-
83
-
84
-
85
-
86
-
87
-
88
-
89
-
90
-
91
-
92
-
93
-
94
-
95
-
96
-
97
-
98
-
99
-
100
-
101
-
102
-
103
-
104
-
105
 |
 |

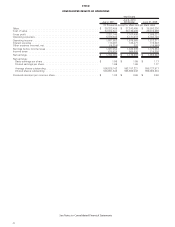
SYSCO
CONSOLIDATED BALANCE SHEETS
July 2, 2011 July 3, 2010
(In thousands except for
share data)
ASSETS
Current assets
Cash and cash equivalents................................................... $ 639,765 $ 585,443
Short-term investments. . ................................................... — 23,511
Accounts and notes receivable, less allowances of $42,436 and $36,573 .................. 2,898,283 2,617,352
Inventories ............................................................. 2,073,766 1,771,539
Prepaid expenses and other current assets ....................................... 72,496 70,992
Prepaid income taxes . . . ................................................... 48,572 7,421
Total current assets . . . ................................................... 5,732,882 5,076,258
Plant and equipment at cost, less depreciation ...................................... 3,512,389 3,203,823
Other assets
Goodwill ............................................................... 1,633,289 1,549,815
Intangibles, less amortization ................................................. 109,938 106,398
Restricted cash .......................................................... 110,516 124,488
Prepaid pension cost....................................................... — —
Other assets ............................................................ 286,541 252,919
Total other assets ....................................................... 2,140,284 2,033,620
Total assets .............................................................. $ 11,385,555 $ 10,313,701
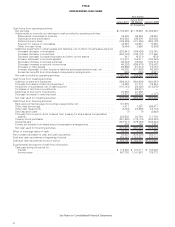
LIABILITIES AND SHAREHOLDERS’ EQUITY
Current liabilities
Notes payable ........................................................... $ 181,975 $ —
Accounts payable ......................................................... 2,183,417 1,953,092
Accrued expenses ........................................................ 856,569 870,114
Deferred income taxes . . ................................................... 146,083 178,022
Current maturities of long-term debt ............................................ 207,031 7,970
Total current liabilities . ................................................... 3,575,075 3,009,198
Other liabilities
Long-term debt .......................................................... 2,279,517 2,472,662
Deferred income taxes . . ................................................... 204,223 271,512
Other long-term liabilities. ................................................... 621,498 732,803
Total other liabilities . . . ................................................... 3,105,238 3,476,977
Commitments and contingencies
Shareholders’ equity
Preferred stock, par value $1 per share
Authorized 1,500,000 shares, issued none ...................................... — —
Common stock, par value $1 per share
Authorized 2,000,000,000 shares, issued 765,174,900 shares ......................... 765,175 765,175
Paid-in capital ............................................................ 887,754 816,833
Retained earnings......................................................... 7,681,669 7,134,139
Accumulated other comprehensive loss . ........................................ (259,958) (480,251)
Treasury stock, 173,597,346 and 176,768,795 shares, at cost .......................... (4,369,398) (4,408,370)
Total shareholders’ equity .................................................. 4,705,242 3,827,526
Total liabilities and shareholders’ equity . . . ........................................ $ 11,385,555 $ 10,313,701
See Notes to Consolidated Financial Statements
41