Sysco 2011 Annual Report Download - page 45
Download and view the complete annual report
Please find page 45 of the 2011 Sysco annual report below. You can navigate through the pages in the report by either clicking on the pages listed below, or by using the keyword search tool below to find specific information within the annual report.-
 1
1 -
2
-
3
-
4
-
5
-
6
-
7
-
8
-
9
-
10
-
11
-
12
-
13
-
14
-
15
-
16
-
17
-
18
-
19
-
20
-
21
-
22
-
23
-
24
-
25
-
26
-
27
-
28
-
29
-
30
-
31
-
32
-
33
-
34
-
 35
35 -
 36
36 -
 37
37 -
 38
38 -
 39
39 -
 40
40 -
 41
41 -
 42
42 -
 43
43 -
 44
44 -
 45
45 -
 46
46 -
 47
47 -
 48
48 -
 49
49 -
 50
50 -
 51
51 -
 52
52 -
 53
53 -
 54
54 -
 55
55 -
56
-
57
-
58
-
59
-
60
-
61
-
62
-
63
-
64
-
65
-
66
-
67
-
68
-
69
-
70
-
71
-
72
-
73
-
74
-
75
-
76
-
77
-
78
-
79
-
80
-
81
-
82
-
83
-
84
-
85
-
86
-
87
-
88
-
89
-
90
-
91
-
92
-
93
-
94
-
95
-
96
-
97
-
98
-
99
-
100
-
101
-
102
-
103
-
104
-
105
 |
 |

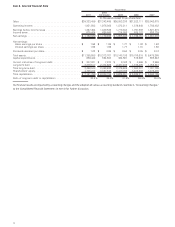
The following table sets forth the operating income of each of our reportable segments and the other segment expressed as a percentage of
each segment’s sales for each period reported and should be read in conjunction with Note 19, “Business Segment Information” to the
Consolidated Financial Statements in Item 8:
2011
2010
(53 Weeks) 2009
Operating Income as a
Percentage of Sales
Broadline ...................................................................... 6.6% 7.0% 6.7%
SYGMA ....................................................................... 1.1 1.0 0.6
Other ........................................................................ 4.2 4.0 3.0
The following table sets forth the change in the selected financial data of each of our reportable segments and the other segment expressed
as a percentage increase over the prior year and should be read in conjunction with Note 19, “Business Segment Information” to the Consolidated
Financial Statements in Item 8:
Sales
Operating
Income Sales
Operating
Income
2011
2010
(53 Weeks)
Broadline ............................................................. 5.1% 0.1% 1.4% 5.9%
SYGMA .............................................................. 9.2 27.3
(1)
1.1 56.7
(1)
Other ................................................................ 5.1 9.6 (2.1) 29.7
(1)
SYGMA had operating income of $60.2 million in fiscal 2011, $47.3 million in fiscal 2010 and $30.2 million in fiscal 2009.
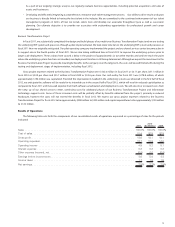
The following table sets forth sales and operating income of each of our reportable segments, the other segment, and intersegment sales,
expressed as a percentage of aggregate segment sales, including intersegment sales, and operating income, respectively. For purposes of this
statistical table, operating income of our segments excludes corporate expenses of $337.1 million in fiscal 2011, $269.6 million in fiscal 2010 and
$219.3 million in fiscal 2009 that are not charged to our segments. This information should be read in conjunction with Note 19, “Business
Segment Information” to the Consolidated Financial Statements in Item 8:
Sales
Segment
Operating
Income Sales
Segment
Operating
Income Sales
Segment
Operating
Income
2011
2010
(53 Weeks) 2009
Broadline ............................................. 81.2% 93.3% 81.6% 94.1% 81.4% 95.5%
SYGMA .............................................. 13.6 2.6 13.1 2.1 13.1 1.4
Other ............................................... 5.6 4.1 5.6 3.8 5.8 3.1
Intersegment sales ...................................... (0.4) — (0.3) — (0.3) —
Total ................................................ 100.0% 100.0% 100.0% 100.0% 100.0% 100.0%
Broadline Segment
The Broadline reportable segment consists of the aggregated results of the United States, Canadian and European Broadline segments, as
well as the custom-cut meat operations. Broadline operating companies distribute a full line of food products and a wide variety of non-food
products to customers. Broadline operations have significantly higher operating margins than the rest of Sysco’s operations. In fiscal 2011, the
Broadline operating results represented approximately 81% of Sysco’s overall sales and 93% of the aggregate operating income of Sysco’s
segments, which excludes corporate expenses and consolidated adjustments.
There are several factors which contribute to these higher operating results as compared to the SYGMA and Other operating segments. We
have invested substantial amounts in assets, operating methods, technology and management expertise in this segment. The breadth of its sales
force, geographic reach of its distribution area and its purchasing power allow us to leverage this segment’s earnings.
Sales
Sales for fiscal 2011 were 5.1% greater than fiscal 2010. Negatively affecting the sales comparison of fiscal 2011 to fiscal 2010 was the
additional week in fiscal 2010. Product cost inflation and the resulting increase in selling prices, combined with case volume improvement,
contributed to the increase in sales in fiscal 2011. Changes in product costs, an internal measure of inflation or deflation, were estimated as
inflation of 4.9% in fiscal 2011. Non-comparable acquisitions contributed 0.8% to the overall sales comparison for fiscal 2011. The changes in the
exchange rates used to translate our foreign sales into U.S. dollars positively impacted sales by 0.6% compared to fiscal 2010.
Sales for fiscal 2010 were 1.4% greater than fiscal 2009. Case volume improvement caused an increase in sales in fiscal 2010 as compared to
fiscal 2009. The changes in the exchange rates used to translate our foreign sales into U.S. dollars positively impacted sales by 1.0% compared to
fiscal 2009. Non-comparable acquisitions contributed 0.6% to the overall sales comparison for fiscal 2010. Changes in product costs were
estimated as deflation of 1.5% in fiscal 2010. This product cost deflation, which led to decreases in selling prices, and a change in customer sales
mix partially offset case volume improvement in fiscal 2010. The additional week also contributed to the sales growth in fiscal 2010.
21