Sysco 2011 Annual Report Download - page 56
Download and view the complete annual report
Please find page 56 of the 2011 Sysco annual report below. You can navigate through the pages in the report by either clicking on the pages listed below, or by using the keyword search tool below to find specific information within the annual report.-
 1
1 -
2
-
3
-
4
-
5
-
6
-
7
-
8
-
9
-
10
-
11
-
12
-
13
-
14
-
15
-
16
-
17
-
18
-
19
-
20
-
21
-
22
-
23
-
24
-
25
-
26
-
27
-
28
-
29
-
30
-
31
-
32
-
33
-
34
-
35
-
36
-
37
-
38
-
39
-
40
-
41
-
42
-
43
-
44
-
45
-
 46
46 -
 47
47 -
 48
48 -
 49
49 -
 50
50 -
 51
51 -
 52
52 -
 53
53 -
 54
54 -
 55
55 -
 56
56 -
 57
57 -
 58
58 -
 59
59 -
 60
60 -
 61
61 -
 62
62 -
 63
63 -
 64
64 -
 65
65 -
 66
66 -
67
-
68
-
69
-
70
-
71
-
72
-
73
-
74
-
75
-
76
-
77
-
78
-
79
-
80
-
81
-
82
-
83
-
84
-
85
-
86
-
87
-
88
-
89
-
90
-
91
-
92
-
93
-
94
-
95
-
96
-
97
-
98
-
99
-
100
-
101
-
102
-
103
-
104
-
105
 |
 |
We arrive at our estimates of fair value using a combination of discounted cash flow and earnings multiple models. The results from each of
these models are then weighted and combined into a single estimate of fair value for each of our eight operating segments. We use a 60%
weighting for our discounted cash flow valuation and 40% for the earnings multiple models giving greater emphasis to our discounted cash flow
model because the forecasted operating results that serve as a basis for the analysis incorporate management’s outlook and anticipated changes
for the businesses. The primary assumptions used in these various models include estimated earnings multiples of comparable acquisitions in the
industry including control premiums, earnings multiples on acquisitions completed by Sysco in the past, future cash flow estimates of the
reporting units, which are dependent on internal forecasts and projected growth rates, and weighted average cost of capital, along with working
capital and capital expenditure requirements. When possible, we use observable market inputs in our models to arrive at the fair values of our
reporting units. We update our projections used in our discounted cash flow model based on historical performance and changing business
conditions for each of our reporting units.
Our estimates of fair value contain uncertainties requiring management to make assumptions and to apply judgment to estimate industry
economic factors and the profitability of future business strategies. Actual results could differ from these assumptions and projections, resulting in
the company revising its assumptions and, if required, recognizing an impairment loss. There were no impairments of goodwill or indefinite-lived
intangibles recorded as a result of assessment in fiscal 2011, 2010 and 2009. Our past estimates of fair value for fiscal 2010 and 2009 have not been
materially different when revised to include subsequent years’ actual results. Sysco has not made any material changes in its impairment
assessment methodology during the past three fiscal years. We do not believe the estimates used in the analysis are reasonably likely to change
materially in the future but we will continue to assess the estimates in the future based on the expectations of the reporting units. In the fiscal
2011 analysis our estimates of fair value did not require additional analysis; however, we would have performed additional analysis to determine if
an impairment existed for the following reporting units if our estimates of fair value were decreased by the following amounts. First, our reporting
unit that distributes to international customers would have required additional analysis if the estimated fair value had been 26% lower. Second,
our European Broadline company would have required additional analysis if the estimated fair value had been 27% lower. Third, our lodging
industry products reporting unit would have required additional analysis if the estimated fair value had been 29% lower. Lastly, our specialty
produce operations would have required additional analysis if the estimated fair value had been 34% lower. At July 2, 2011, these four reporting
units had goodwill aggregating $498.3 million. For the remainder of our reporting units which at July 2, 2011 had goodwill aggregating
$1.1 billion, we would have performed additional analysis to determine if an impairment existed for a reporting unit if the estimated fair value for
any of these reporting units had declined by greater than 50%.
Certain reporting units (European Broadline, specialty produce, custom-cut meat, lodging industry products and international distribution
operations) have a greater proportion of goodwill recorded to estimated fair value as compared to the United States Broadline, Canadian
Broadline or SYGMA reporting units. This is primarily due to these businesses having been recently acquired, and as a result there has been less
history of organic growth than in the United States Broadline, Canadian Broadline and SYGMA reporting units. In addition, these businesses also
have lower levels of cash flow than the United States Broadline reporting units. As such, these reporting units have a greater risk of future
impairment if their operations were to suffer a significant downturn.
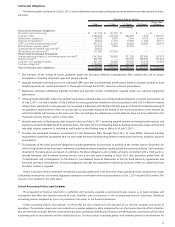
Share-Based Compensation
We provide compensation benefits to employees and non-employee directors under several share-based payment arrangements including
various employee stock incentive plans, the Employees’ Stock Purchase Plan, the Management Incentive Plan and various non-employee director
plans.
As of July 2, 2011, there was $61.3 million of total unrecognized compensation cost related to share-based compensation arrangements. That
cost is expected to be recognized over a weighted-average period of 2.62 years.
The fair value of each option award is estimated on the date of grant using a Black-Scholes option pricing model. Expected volatility is based
on historical volatility of Sysco’s stock, implied volatilities from traded options on Sysco’s stock and other factors. We utilize historical data to
estimate option exercise and employee termination behavior within the valuation model; separate groups of employees that have similar
historical exercise behavior are considered separately for valuation purposes. Expected dividend yield is estimated based on the historical pattern
of dividends and the average stock price for the year preceding the option grant. The risk-free rate for the expected term of the option is based on
the U.S. Treasury yield curve in effect at the time of grant.
The fair value of each restricted stock unit award granted with a dividend equivalent is based on the company’s stock price as of the date of
grant. For restricted stock units granted without dividend equivalents, the fair value is reduced by the present value of expected dividends during
the vesting period.
The fair value of the stock issued under the Employee Stock Purchase Plan is calculated as the difference between the stock price and the
employee purchase price.
The fair value of restricted stock granted to employees is based on the stock price on grant date. The application of a discount to the fair value
of a restricted stock grant is dependent upon whether or not each individual grant contains a post-vesting restriction.
The compensation cost related to these share-based awards is recognized over the requisite service period. The requisite service period is
generally the period during which an employee is required to provide service in exchange for the award. The compensation cost related to stock
32