Sysco 2011 Annual Report Download - page 99
Download and view the complete annual report
Please find page 99 of the 2011 Sysco annual report below. You can navigate through the pages in the report by either clicking on the pages listed below, or by using the keyword search tool below to find specific information within the annual report.-
 1
1 -
2
-
3
-
4
-
5
-
6
-
7
-
8
-
9
-
10
-
11
-
12
-
13
-
14
-
15
-
16
-
17
-
18
-
19
-
20
-
21
-
22
-
23
-
24
-
25
-
26
-
27
-
28
-
29
-
30
-
31
-
32
-
33
-
34
-
35
-
36
-
37
-
38
-
39
-
40
-
41
-
42
-
43
-
44
-
45
-
46
-
47
-
48
-
49
-
50
-
51
-
52
-
53
-
54
-
55
-
56
-
57
-
58
-
59
-
60
-
61
-
62
-
63
-
64
-
65
-
66
-
67
-
68
-
69
-
70
-
71
-
72
-
73
-
74
-
75
-
76
-
77
-
78
-
79
-
80
-
81
-
82
-
83
-
84
-
85
-
86
-
87
-
88
-
 89
89 -
 90
90 -
 91
91 -
 92
92 -
 93
93 -
 94
94 -
 95
95 -
 96
96 -
 97
97 -
 98
98 -
 99
99 -
 100
100 -
 101
101 -
 102
102 -
 103
103 -
 104
104 -
 105
105
 |
 |

Sysco
U.S.
Broadline
Subsidiaries
Other
Non-Guarantor
Subsidiaries
Consolidated
Totals
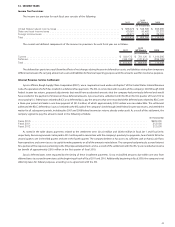
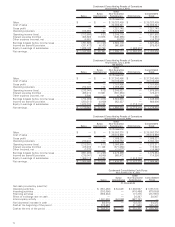
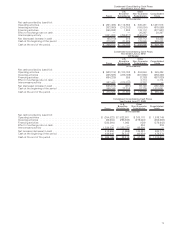
Condensed Consolidating Cash Flows
Year Ended July 2, 2011
(In thousands)
Net cash provided by (used for):
Operating activities ........................................ $ (351,468) $1,112,555 $ 330,431 $ 1,091,518
Investing activities ........................................ (203,090) (318,382) (158,084) (679,556)
Financing activities ........................................ (555,282) 1,263 176,112 (377,907)
Effect of exchange rate on cash . . ............................. — — 20,267 20,267
Intercompany activity ...................................... 1,041,830 (795,217) (246,613) —
Net (decrease) increase in cash . . ............................. (68,010) 219 122,113 54,322
Cash at the beginning of the period ............................ 373,523 31,935 179,985 585,443
Cash at the end of the period ................................. $ 305,513 $ 32,154 $ 302,098 $ 639,765
Sysco
U.S.
Broadline
Subsidiaries
Other
Non-Guarantor
Subsidiaries
Consolidated
Totals
Condensed Consolidating Cash Flows
Year Ended July 3, 2010
(53 Weeks)
(In thousands)
Net cash provided by (used for):
Operating activities ........................................ $ (503,318) $1,103,762 $ 284,984 $ 885,428
Investing activities ........................................ (225,565) (228,769) (201,986) (656,320)
Financing activities ........................................ (664,236) 559 (3,353) (667,030)
Effect of exchange rate on cash . . ............................. — — 4,714 4,714
Intercompany activity ...................................... 867,446 (875,833) 8,387 —
Net (decrease) increase in cash . . ............................. (525,673) (281) 92,746 (433,208)
Cash at the beginning of the period ............................ 899,196 32,216 87,239 1,018,651
Cash at the end of the period ................................. $ 373,523 $ 31,935 $ 179,985 $ 585,443
Sysco
U.S.
Broadline
Subsidiaries
Other
Non-Guarantor
Subsidiaries
Consolidated
Totals
Condensed Consolidating Cash Flows
Year Ended June 27, 2009
(In thousands)
Net cash provided by (used for):
Operating activities ....................................... $ (354,022) $ 1,622,601 $ 308,170 $ 1,576,749
Investing activities ....................................... (82,684) (296,933) (279,046) (658,663)
Financing activities ....................................... (380,564) 1,060 (139) (379,643)
Effect of exchange rate on cash .............................. — — 334 334
Intercompany activity ..................................... 1,229,820 (1,328,724) 98,904 —
Net increase (decrease) in cash .............................. 412,550 (1,996) 128,223 538,777
Cash at the beginning of the period............................ 486,646 34,212 (40,984) 479,874
Cash at the end of the period ................................ $ 899,196 $ 32,216 $ 87,239 $ 1,018,651
75