Sysco 2011 Annual Report Download - page 98
Download and view the complete annual report
Please find page 98 of the 2011 Sysco annual report below. You can navigate through the pages in the report by either clicking on the pages listed below, or by using the keyword search tool below to find specific information within the annual report.-
 1
1 -
2
-
3
-
4
-
5
-
6
-
7
-
8
-
9
-
10
-
11
-
12
-
13
-
14
-
15
-
16
-
17
-
18
-
19
-
20
-
21
-
22
-
23
-
24
-
25
-
26
-
27
-
28
-
29
-
30
-
31
-
32
-
33
-
34
-
35
-
36
-
37
-
38
-
39
-
40
-
41
-
42
-
43
-
44
-
45
-
46
-
47
-
48
-
49
-
50
-
51
-
52
-
53
-
54
-
55
-
56
-
57
-
58
-
59
-
60
-
61
-
62
-
63
-
64
-
65
-
66
-
67
-
68
-
69
-
70
-
71
-
72
-
73
-
74
-
75
-
76
-
77
-
78
-
79
-
80
-
81
-
82
-
83
-
84
-
85
-
86
-
87
-
 88
88 -
 89
89 -
 90
90 -
 91
91 -
 92
92 -
 93
93 -
 94
94 -
 95
95 -
 96
96 -
 97
97 -
 98
98 -
 99
99 -
 100
100 -
 101
101 -
 102
102 -
 103
103 -
 104
104 -
 105
105
 |
 |

Sysco
U.S.
Broadline
Subsidiaries
Other
Non-Guarantor
Subsidiaries Eliminations
Consolidated
Totals
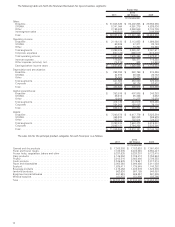
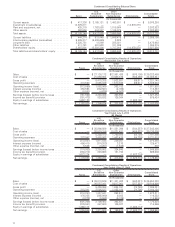
Condensed Consolidating Balance Sheet
July 3, 2010
(In thousands)
Current assets .......................... $ 417,336 $ 3,165,121 $ 1,493,801 $ — $ 5,076,258
Investment in subsidiaries.................. 14,979,871 — — (14,979,871) —
Plant and equipment, net .................. 425,279 1,762,580 1,015,964 — 3,203,823
Other assets ........................... 362,658 484,887 1,186,075 — 2,033,620
Total assets ............................ $ 16,185,144 $ 5,412,588 $ 3,695,840 $ (14,979,871) $ 10,313,701
Current liabilities ........................ $ 444,274 $ 918,449 $ 1,646,475 $ — $ 3,009,198
Intercompany payables (receivables) . . ........ 9,405,317 (9,408,645) 3,328 — —
Long-term debt ......................... 2,225,781 18,860 228,021 — 2,472,662
Other liabilities ......................... 411,781 491,528 101,006 — 1,004,315
Shareholders’ equity. . .................... 3,697,991 13,392,396 1,717,010 (14,979,871) 3,827,526
Total liabilities and shareholders’ equity. ........ $ 16,185,144 $ 5,412,588 $ 3,695,840 $ (14,979,871) $ 10,313,701
Sysco
U.S.
Broadline
Subsidiaries
Other
Non-Guarantor
Subsidiaries Eliminations
Consolidated
Totals
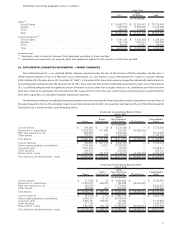
Condensed Consolidating Results of Operations
Year Ended July 2, 2011
(In thousands)
Sales . .................................. $ — $27,138,172 $12,861,426 $ (676,109) $ 39,323,489
Cost of sales ............................. — 21,659,964 10,928,875 (586,498) 32,002,341
Gross profit .............................. — 5,478,208 1,932,551 (89,611) 7,321,148
Operating expenses . ....................... 313,550 3,595,339 1,570,368 (89,611) 5,389,646
Operating income (loss) ...................... (313,550) 1,882,869 362,183 — 1,931,502
Interest expense (income) .................... 453,593 (332,561) (2,765) — 118,267
Other expense (income), net .................. (5,581) (4,636) (4,002) — (14,219)
Earnings (losses) before income taxes ............ (761,562) 2,220,066 368,950 — 1,827,454
Income tax (benefit) provision .................. (281,472) 820,532 136,364 — 675,424
Equity in earnings of subsidiaries . . . ............ 1,632,120 — — (1,632,120) —
Net earnings.............................. $ 1,152,030 $ 1,399,534 $ 232,586 $ (1,632,120) $ 1,152,030
Sysco
U.S.
Broadline
Subsidiaries
Other
Non-Guarantor
Subsidiaries Eliminations
Consolidated
Totals
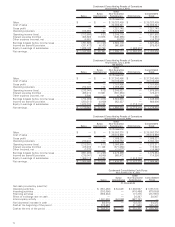
Condensed Consolidating Results of Operations
Year Ended July 3, 2010
(53 Weeks)
(In thousands)
Sales . .................................. $ — $25,966,566 $11,821,286 $ (544,357) $ 37,243,495
Cost of sales ............................. — 20,574,156 10,021,481 (459,628) 30,136,009
Gross profit .............................. — 5,392,410 1,799,805 (84,729) 7,107,486
Operating expenses . ....................... 272,047 3,480,862 1,463,438 (84,729) 5,131,618
Operating income (loss) ...................... (272,047) 1,911,548 336,367 — 1,975,868
Interest expense (income) .................... 496,410 (374,203) 3,270 — 125,477
Other expense (income), net .................. 5,546 (3,201) (1,543) — 802
Earnings (losses) before income taxes ............ (774,003) 2,288,952 334,640 — 1,849,589
Income tax (benefit) provision .................. (280,212) 828,668 121,150 — 669,606
Equity in earnings of subsidiaries . . . ............ 1,673,774 — — (1,673,774) —
Net earnings.............................. $ 1,179,983 $ 1,460,284 $ 213,490 $ (1,673,774) $ 1,179,983
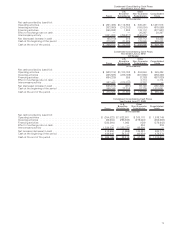
Sysco
U.S.
Broadline
Subsidiaries
Other
Non-Guarantor
Subsidiaries Eliminations
Consolidated
Totals
Condensed Consolidating Results of Operations
Year Ended June 27, 2009
(In thousands)
Sales . .................................. $ — $26,013,529 $11,301,822 $ (462,021) $ 36,853,330
Cost of sales ............................. — 20,587,161 9,617,061 (387,223) 29,816,999
Gross profit .............................. — 5,426,368 1,684,761 (74,798) 7,036,331
Operating expenses . ....................... 218,241 3,598,527 1,422,150 (74,798) 5,164,120
Operating income (loss) ...................... (218,241) 1,827,841 262,611 — 1,872,211
Interest expense (income) .................... 476,238 (365,999) 6,083 — 116,322
Other expense (income), net .................. (3,273) (5,563) (6,109) — (14,945)
Earnings (losses) before income taxes ............ (691,206) 2,199,403 262,637 — 1,770,834
Income tax (benefit) provision .................. (279,041) 887,900 106,027 — 714,886
Equity in earnings of subsidiaries . . . ............ 1,468,113 — — (1,468,113) —
Net earnings.............................. $ 1,055,948 $ 1,311,503 $ 156,610 $ (1,468,113) $ 1,055,948
74