Sysco 2011 Annual Report Download - page 79
Download and view the complete annual report
Please find page 79 of the 2011 Sysco annual report below. You can navigate through the pages in the report by either clicking on the pages listed below, or by using the keyword search tool below to find specific information within the annual report.-
 1
1 -
2
-
3
-
4
-
5
-
6
-
7
-
8
-
9
-
10
-
11
-
12
-
13
-
14
-
15
-
16
-
17
-
18
-
19
-
20
-
21
-
22
-
23
-
24
-
25
-
26
-
27
-
28
-
29
-
30
-
31
-
32
-
33
-
34
-
35
-
36
-
37
-
38
-
39
-
40
-
41
-
42
-
43
-
44
-
45
-
46
-
47
-
48
-
49
-
50
-
51
-
52
-
53
-
54
-
55
-
56
-
57
-
58
-
59
-
60
-
61
-
62
-
63
-
64
-
65
-
66
-
67
-
68
-
 69
69 -
 70
70 -
 71
71 -
 72
72 -
 73
73 -
 74
74 -
 75
75 -
 76
76 -
 77
77 -
 78
78 -
 79
79 -
 80
80 -
 81
81 -
 82
82 -
 83
83 -
 84
84 -
 85
85 -
 86
86 -
 87
87 -
 88
88 -
 89
89 -
90
-
91
-
92
-
93
-
94
-
95
-
96
-
97
-
98
-
99
-
100
-
101
-
102
-
103
-
104
-
105
 |
 |

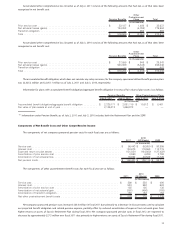
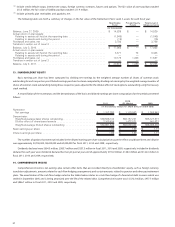
Accumulated other comprehensive loss (income) as of July 2, 2011 consists of the following amounts that had not, as of that date, been
recognized in net benefit cost:
Pension Benefits
Other
Postretirement
Plans Total
(In thousands)
Prior service cost ............................................. $ 32,187 $ 1,450 $ 33,637
Net actuarial losses (gains). . ..................................... 784,382 (4,798) 779,584
Transition obligation ........................................... — 294 294
Total ...................................................... $ 816,569 $ (3,054) $ 813,515
Accumulated other comprehensive loss (income) as of July 3, 2010 consists of the following amounts that had not, as of that date, been
recognized in net benefit cost:
Pension Benefits
Other
Postretirement
Plans Total
(In thousands)
Prior service cost ............................................. $ 27,895 $ 648 $ 28,543
Net actuarial losses (gains). . ..................................... 948,389 (5,343) 943,046
Transition obligation ........................................... — 447 447
Total ...................................................... $ 976,284 $ (4,248) $ 972,036
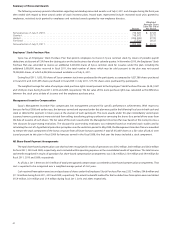
The accumulated benefit obligation, which does not consider any salary increases, for the company-sponsored defined benefit pension plans
was $2,325.2 million and $2,051.1 million as of July 2, 2011 and July 3, 2010, respectively.
Information for plans with accumulated benefit obligation/aggregate benefit obligation in excess of fair value of plan assets is as follows:
July 2, 2011
(1)
July 3, 2010
(1)
July 2, 2011 July 3, 2010
Pension Benefits Other Postretirement Plans
(In thousands)
Accumulated benefit obligation/aggregate benefit obligation ......... $ 2,325,171 $ 2,051,115 $ 10,812 $ 8,461
Fair value of plan assets at end of year . . ...................... 2,106,313 1,666,972 — —
(1)
Information under Pension Benefits as of July 2, 2011 and July 3, 2010 includes both the Retirement Plan and the SERP.
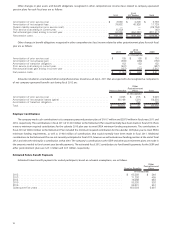
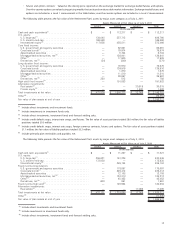
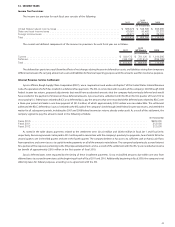
Components of Net Benefit Costs and Other Comprehensive Income
The components of net company-sponsored pension costs for each fiscal year are as follows:
2011
2010
(53 Weeks) 2009
(In thousands)
Service cost .......................................................... $ 99,443 $ 66,650 $ 80,899
Interest cost ......................................................... 134,973 119,593 113,715
Expected return on plan assets ............................................ (131,921) (104,860) (127,422)
Amortization of prior service cost ........................................... 3,960 4,209 3,793
Amortization of net actuarial loss ........................................... 79,952 40,526 17,729
Net pension costs ...................................................... $ 186,407 $ 126,118 $ 88,714
The components of other postretirement benefit costs for each fiscal year are as follows:
2011
2010
(53 Weeks) 2009
(In thousands)
Service cost ........................................................ $ 396 $ 328 $ 490
Interest cost ........................................................ 524 562 624
Amortization of prior service cost . . ....................................... 185 185 130
Amortization of net actuarial gain. . . ....................................... (388) (490) (158)
Amortization of transition obligation . ....................................... 153 153 153
Net other postretirement benefit costs ..................................... $ 870 $ 738 $ 1,239
Net company-sponsored pension costs increased $60.3 million in fiscal 2011 due primarily to a decrease in discount rates used to calculate
our projected benefit obligation and related pension expense, partially offset by reduced amortization of expense from actuarial gains from
higher returns on assets of Sysco’s Retirement Plan during fiscal 2010. Net company-sponsored pension costs in fiscal 2012 are expected to
decrease by approximately $27.3 million over fiscal 2011 due primarily to higher returns on assets of Sysco’s Retirement Plan during fiscal 2011.
55