Sysco 2011 Annual Report Download - page 66
Download and view the complete annual report
Please find page 66 of the 2011 Sysco annual report below. You can navigate through the pages in the report by either clicking on the pages listed below, or by using the keyword search tool below to find specific information within the annual report.-
 1
1 -
2
-
3
-
4
-
5
-
6
-
7
-
8
-
9
-
10
-
11
-
12
-
13
-
14
-
15
-
16
-
17
-
18
-
19
-
20
-
21
-
22
-
23
-
24
-
25
-
26
-
27
-
28
-
29
-
30
-
31
-
32
-
33
-
34
-
35
-
36
-
37
-
38
-
39
-
40
-
41
-
42
-
43
-
44
-
45
-
46
-
47
-
48
-
49
-
50
-
51
-
52
-
53
-
54
-
55
-
 56
56 -
 57
57 -
 58
58 -
 59
59 -
 60
60 -
 61
61 -
 62
62 -
 63
63 -
 64
64 -
 65
65 -
 66
66 -
 67
67 -
 68
68 -
 69
69 -
 70
70 -
 71
71 -
 72
72 -
 73
73 -
 74
74 -
 75
75 -
 76
76 -
77
-
78
-
79
-
80
-
81
-
82
-
83
-
84
-
85
-
86
-
87
-
88
-
89
-
90
-
91
-
92
-
93
-
94
-
95
-
96
-
97
-
98
-
99
-
100
-
101
-
102
-
103
-
104
-
105
 |
 |

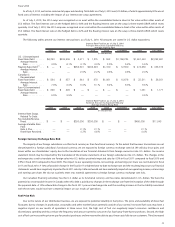
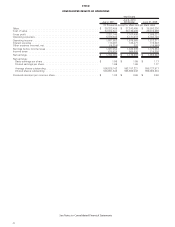
SYSCO
CONSOLIDATED RESULTS OF OPERATIONS
July 2, 2011
July 3, 2010
(53 Weeks) June 27, 2009
Year Ended
(In thousands except for share and per share data)
Sales ................................................... $ 39,323,489 $ 37,243,495 $ 36,853,330
Cost of sales.............................................. 32,002,341 30,136,009 29,816,999
Gross profit .............................................. 7,321,148 7,107,486 7,036,331
Operating expenses . ........................................ 5,389,646 5,131,618 5,164,120
Operating income . . ........................................ 1,931,502 1,975,868 1,872,211
Interest expense . . . ........................................ 118,267 125,477 116,322
Other expense (income), net................................... (14,219) 802 (14,945)
Earnings before income taxes .................................. 1,827,454 1,849,589 1,770,834
Income taxes ............................................. 675,424 669,606 714,886
Net earnings .............................................. $ 1,152,030 $ 1,179,983 $ 1,055,948
Net earnings:
Basic earnings per share .................................... $ 1.96 $ 1.99 $ 1.77
Diluted earnings per share ................................... 1.96 1.99 1.77
Average shares outstanding.................................. 586,526,142 592,157,221 595,127,577
Diluted shares outstanding .................................. 588,691,546 593,590,042 596,069,204
Dividends declared per common share ............................ $ 1.03 $ 0.99 $ 0.94
See Notes to Consolidated Financial Statements
42