Sysco 2011 Annual Report Download - page 90
Download and view the complete annual report
Please find page 90 of the 2011 Sysco annual report below. You can navigate through the pages in the report by either clicking on the pages listed below, or by using the keyword search tool below to find specific information within the annual report.-
 1
1 -
2
-
3
-
4
-
5
-
6
-
7
-
8
-
9
-
10
-
11
-
12
-
13
-
14
-
15
-
16
-
17
-
18
-
19
-
20
-
21
-
22
-
23
-
24
-
25
-
26
-
27
-
28
-
29
-
30
-
31
-
32
-
33
-
34
-
35
-
36
-
37
-
38
-
39
-
40
-
41
-
42
-
43
-
44
-
45
-
46
-
47
-
48
-
49
-
50
-
51
-
52
-
53
-
54
-
55
-
56
-
57
-
58
-
59
-
60
-
61
-
62
-
63
-
64
-
65
-
66
-
67
-
68
-
69
-
70
-
71
-
72
-
73
-
74
-
75
-
76
-
77
-
78
-
79
-
 80
80 -
 81
81 -
 82
82 -
 83
83 -
 84
84 -
 85
85 -
 86
86 -
 87
87 -
 88
88 -
 89
89 -
 90
90 -
 91
91 -
 92
92 -
 93
93 -
 94
94 -
 95
95 -
 96
96 -
 97
97 -
 98
98 -
 99
99 -
 100
100 -
101
-
102
-
103
-
104
-
105
 |
 |

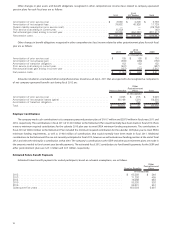
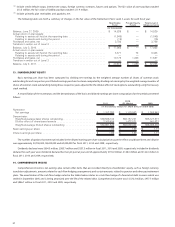
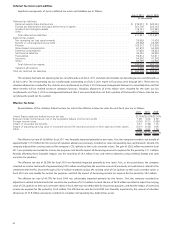
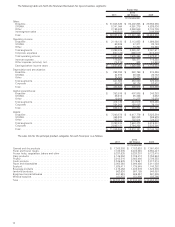
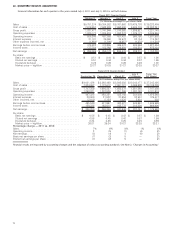
Deferred Tax Assets and Liabilities
Significant components of Sysco’s deferred tax assets and liabilities are as follows:
July 2, 2011 July 3, 2010
(In thousands)
Deferred tax liabilities:
Deferred supply chain distributions ................................................. $ 276,001 $ 542,424
Excess tax depreciation and basis differences of assets................................... 384,702 288,122
Goodwill and intangible assets . ................................................... 175,747 157,943
Other...................................................................... 35,497 26,032
Total deferred tax liabilities . . ................................................... 871,947 1,014,521
Deferred tax assets:
Net operating tax loss carryforwards ................................................ 35,989 70,439
Benefit on unrecognized tax benefits ................................................ 23,463 32,790
Pension .................................................................... 162,212 213,398
Share-based compensation....................................................... 61,978 54,426
Deferred compensation ......................................................... 37,659 39,823
Self-insured liabilities ........................................................... 40,454 40,623
Receivables . . . .............................................................. 52,614 54,511
Inventory ................................................................... 54,853 47,256
Other...................................................................... 56,465 34,836
Total deferred tax assets ....................................................... 525,687 588,102
Valuation allowances ........................................................... 4,046 23,115
Total net deferred tax liabilities . . . ................................................... $ 350,306 $ 449,534
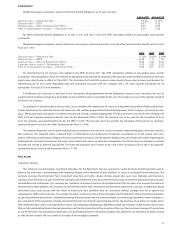
The company had state net operating tax loss carryforwards as of July 2, 2011 and state and Canadian net operating tax loss carryforwards as
of July 3, 2010. The net operating tax loss carryforwards outstanding as of July 2, 2011 expire in fiscal years 2012 through 2031. There were no
valuation allowances recorded for the state tax loss carryforwards as of July 2, 2011 because management believes it is more likely than not that
these benefits will be realized based on utilization forecasts. Valuation allowances of $19.8 million were recorded for the state tax loss
carryforwards as of July 3, 2010, as management believed that it was more likely than not that a portion of the benefits of these state tax loss
carryforwards would not be realized.
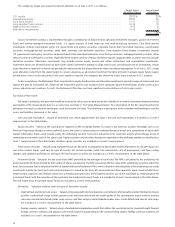
Effective Tax Rates
Reconciliations of the statutory federal income tax rate to the effective income tax rates for each fiscal year are as follows:
2011 2010 2009
United States statutory federal income tax rate . ............................................ 35.00%35.00%35.00%
State and local income taxes, net of any applicable federal income tax benefit . . ..................... 1.96 2.89 2.59
Foreign income taxes ............................................................... (0.50) (0.31) (0.96)
Impact of uncertain tax benefits . ....................................................... 0.51 (1.46) 1.75
Impact of adjusting carrying value of corporate-owned life insurance policies to their cash surrender values . . . (0.61) (0.45) 0.95
Other .......................................................................... 0.60 0.53 1.04
36.96%36.20%40.37%
The effective tax rate of 36.96% for fiscal 2011 was favorably impacted primarily by two items. First, the company recorded a tax benefit of
approximately $17.0 million for the reversal of valuation allowances previously recorded on state net operating loss carryforwards. Second, the
company adjusted the carrying values of the company’s COLI policies to their cash surrender values. The gain of $28.2 million recorded in fiscal
2011 was primarily non-taxable for income tax purposes, and had the impact of decreasing income tax expense for the period by $11.1 million.
Partially offsetting these favorable impacts was the recording of $9.3 million in tax and interest related to various federal, foreign and state
uncertain tax positions.
The effective tax rate of 36.20% for fiscal 2010 was favorably impacted primarily by two items. First, as discussed above, the company
recorded an income tax benefit of approximately $29.0 million resulting from the one-time reversal of previously accrued interest related to the
settlement with the IRS. Second, the gain of $21.6 million recorded to adjust the carrying value of COLI policies to their cash surrender values in
fiscal 2010 was non-taxable for income tax purposes, and had the impact of decreasing income tax expense for the period by $8.3 million.
The effective tax rate of 40.37% for fiscal 2009 was unfavorably impacted primarily by two factors. First, the company recorded tax
adjustments related to federal and state uncertain tax positions of $31.0 million. Second, the loss of $43.8 million recorded to adjust the carrying
value of COLI policies to their cash surrender values in fiscal 2009 was non-deductible for income tax purposes, and had the impact of increasing
income tax expense for the period by $16.8 million. The effective tax rate for fiscal 2009 was favorably impacted by the reversal of valuation
allowances of $7.8 million previously recorded on Canadian net operating loss deferred tax assets.
66