Sysco 2011 Annual Report Download - page 49
Download and view the complete annual report
Please find page 49 of the 2011 Sysco annual report below. You can navigate through the pages in the report by either clicking on the pages listed below, or by using the keyword search tool below to find specific information within the annual report.-
 1
1 -
2
-
3
-
4
-
5
-
6
-
7
-
8
-
9
-
10
-
11
-
12
-
13
-
14
-
15
-
16
-
17
-
18
-
19
-
20
-
21
-
22
-
23
-
24
-
25
-
26
-
27
-
28
-
29
-
30
-
31
-
32
-
33
-
34
-
35
-
36
-
37
-
38
-
 39
39 -
 40
40 -
 41
41 -
 42
42 -
 43
43 -
 44
44 -
 45
45 -
 46
46 -
 47
47 -
 48
48 -
 49
49 -
 50
50 -
 51
51 -
 52
52 -
 53
53 -
 54
54 -
 55
55 -
 56
56 -
 57
57 -
 58
58 -
 59
59 -
60
-
61
-
62
-
63
-
64
-
65
-
66
-
67
-
68
-
69
-
70
-
71
-
72
-
73
-
74
-
75
-
76
-
77
-
78
-
79
-
80
-
81
-
82
-
83
-
84
-
85
-
86
-
87
-
88
-
89
-
90
-
91
-
92
-
93
-
94
-
95
-
96
-
97
-
98
-
99
-
100
-
101
-
102
-
103
-
104
-
105
 |
 |
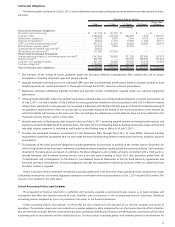
Structure”), which resulted in the payment of taxes of $212.0 million in fiscal 2011 and $528.0 million in fiscal 2010 for the settlement agreement.
Partially offsetting the negative impact described above, the change in deferred tax assets and liabilities was impacted by the contribution of an
additional $140.0 million to our company-sponsored qualified pension plan in fiscal 2010 for contributions that would normally have been made
in fiscal 2011. Cash flow from operations for fiscal 2009 was positively impacted by an increase in accrued income taxes of $325.5 million, partially
offset by changes in deferred tax assets and liabilities of $294.2 million. Total cash taxes paid were $907.7 million, $1,142.0 million and
$735.8 million in fiscal 2011, 2010 and 2009, respectively. The changes in all periods were also impacted by the current tax provision and current
year estimated tax payments.
Other long-term liabilities increased $44.3 million during fiscal 2011. The increase for 2011 was primarily attributable to three items. First, we
recorded withdrawal liabilities from multi-employer pension plans from which union members elected to withdraw during the period. Second,
net company sponsored pension costs exceeded contributions to our company-sponsored pension plans during the period. Third, we recognized
a provision for severance resulting from the implementation of an involuntary severance plan. Partially offsetting these increases, our liability for
uncertain tax positions decreased as a result of settlements with various taxing authorities during the period.
Other long-term liabilities and prepaid pension cost, net, decreased $271.7 million during fiscal 2010. The decrease in fiscal 2010 is primarily
attributable to three items. First, pension contributions to our company-sponsored plans exceeded net company-sponsored pension costs.
Second, our liability for deferred incentive compensation decreased due to accelerated distributions taken by plan participants of all or a portion
of their vested balances pursuant to certain transitional relief under the provisions of Section 409A of the Internal Revenue Code and other regular
distributions. Third, our liability for uncertain tax positions decreased as a result of the settlement with the IRS, as well as a reclass to accrued
income taxes for amounts expected to be paid in fiscal 2011.
Other long-term liabilities and prepaid pension cost, net, decreased $48.4 million during fiscal 2009. The decrease in fiscal 2009 is primarily
attributable to a decrease in our liability for uncertain tax benefits related to our settlement with the IRS. See additional discussion of an IRS
settlement at “Other Considerations, BSCC Cooperative Structure.” The decrease was partially offset by a combination of the recording of net
company-sponsored pension costs and incentive compensation deferrals.
We recorded net company-sponsored pension costs of $186.4 million, $126.1 million and $88.7 million during fiscal 2011, fiscal 2010 and
fiscal 2009, respectively. Our contributions to our company-sponsored defined benefit plans were $161.7 million, $297.9 million and $95.8 million
during fiscal 2011, fiscal 2010 and fiscal 2009, respectively. Included in the $161.7 million of contributions in fiscal 2011 was a $140.0 million
contribution to our Retirement Plan that would normally have been made in fiscal 2012. Included in the $297.9 million of contributions in fiscal
2010 was a $140.0 million contribution to our Retirement Plan that would normally have been made in fiscal 2011 and quarterly contributions
totaling $140.0 million for fiscal 2010. Additional contributions to our Retirement Plan are not currently anticipated in fiscal 2012, however we will
evaluate our funding position at the end of fiscal 2012 and select the timing for a contribution at that time.
Investing Activities
Fiscal 2011 capital expenditures included:
• investments in technology including our Business Transformation Project;
• fleet replacements;
• replacement or significant expansion of facilities in Philadelphia, Pennsylvania and central Texas;
• the purchase of land for a fold-out facility in southern California; and
• the remodeling of our shared services facility purchased in fiscal 2010.
Fiscal 2010 capital expenditures included:
• investments in technology including our Business Transformation Project;
• fleet replacements;
• replacement or significant expansion of facilities in Vancouver, British Columbia, Canada; Winnipeg, Manitoba, Canada; Billings, Montana;
Plainfield, New Jersey; Philadelphia, Pennsylvania and Houston, Texas;
• the purchase of a facility for our future shared services operations in connection with our Business Transformation Project; and
• the purchase of land for a fold-out facility in Long Island, New York.
Fiscal 2009 capital expenditures included:
• construction of a fold-out facility in Longview, Texas;
• replacement or significant expansion of facilities in Victoria, British Columbia, Canada; Chicago, Illinois; Pittsburgh, Pennsylvania and
Houston, Texas;
• land purchases for future fold-out facilities; and
• investments in technology for our Business Transformation Project.
25