Sysco 2011 Annual Report Download - page 50
Download and view the complete annual report
Please find page 50 of the 2011 Sysco annual report below. You can navigate through the pages in the report by either clicking on the pages listed below, or by using the keyword search tool below to find specific information within the annual report.-
 1
1 -
2
-
3
-
4
-
5
-
6
-
7
-
8
-
9
-
10
-
11
-
12
-
13
-
14
-
15
-
16
-
17
-
18
-
19
-
20
-
21
-
22
-
23
-
24
-
25
-
26
-
27
-
28
-
29
-
30
-
31
-
32
-
33
-
34
-
35
-
36
-
37
-
38
-
39
-
 40
40 -
 41
41 -
 42
42 -
 43
43 -
 44
44 -
 45
45 -
 46
46 -
 47
47 -
 48
48 -
 49
49 -
 50
50 -
 51
51 -
 52
52 -
 53
53 -
 54
54 -
 55
55 -
 56
56 -
 57
57 -
 58
58 -
 59
59 -
 60
60 -
61
-
62
-
63
-
64
-
65
-
66
-
67
-
68
-
69
-
70
-
71
-
72
-
73
-
74
-
75
-
76
-
77
-
78
-
79
-
80
-
81
-
82
-
83
-
84
-
85
-
86
-
87
-
88
-
89
-
90
-
91
-
92
-
93
-
94
-
95
-
96
-
97
-
98
-
99
-
100
-
101
-
102
-
103
-
104
-
105
 |
 |

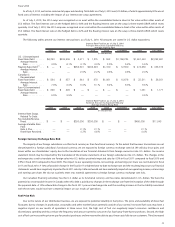
We expect total capital expenditures in fiscal 2012 to be in the range of $750 million to $800 million. Fiscal 2012 expenditures will include
facility, fleet and other equipment replacements and expansions; new facility construction, including fold-out facilities; and investments in
technology including our Business Transformation Project.
During fiscal 2011, in the aggregate, the company paid cash of $101.1 million for operations acquired during fiscal 2011 and for contingent
consideration related to operations acquired in previous fiscal years. During fiscal 2011, we acquired for cash broadline foodservice operations in
central California; Los Angeles, California; Ontario, Canada; Lincoln, Nebraska; and Trenton, New Jersey.
During fiscal 2010, in the aggregate, the company paid cash of $29.3 million for operations acquired during fiscal 2010 and for contingent
consideration related to operations acquired in previous fiscal years. During fiscal 2010, we acquired for cash a broadline foodservice operation in
Syracuse, New York, a produce distributor in Atlanta, Georgia and a seafood distributor in Edmonton, Alberta, Canada.
During fiscal 2009, in the aggregate the company paid cash of $218.1 million for operations acquired during fiscal 2009 and for contingent
consideration related to operations acquired in previous fiscal years. During fiscal 2009, we acquired for cash broadline foodservice operations in
Ireland, Los Angeles, California and Boston, Massachusetts, as well as a produce distributor in Toronto, Ontario, Canada.
Financing Activities
Equity
Proceeds from common stock reissued from treasury for share-based compensation awards were $332.7 million in fiscal 2011, $94.8 million in
fiscal 2010 and $111.8 million in fiscal 2009. The increase in proceeds in fiscal 2011 was due to an increase in the number of options exercised in
fiscal 2011, as compared to fiscal 2010 and 2009. The level of option exercises, and thus proceeds, will vary from period to period and is largely
dependent on movements in our stock price.
We traditionally have engaged in Board-approved share repurchase programs. The number of shares acquired and their cost during the past
three fiscal years were 10,000,000 shares for $291.6 million in fiscal 2011, 6,000,000 shares for $179.2 million in fiscal 2010 and 16,951,200 shares for
$438.8 million in fiscal 2009. There were no additional shares repurchased through August 17, 2011, resulting in a remaining authorization by our
Board of Directors to repurchase up to 13,386,600 shares, based on the trades made through that date. Our current share repurchase strategy is to
purchase enough shares to keep our diluted average shares outstanding relatively constant. Based on forecasted and past share exercises
pursuant to our option plans, we expect to repurchase slightly more shares in fiscal 2012 than in fiscal 2011.
Dividends paid were $597.1 million, or $1.02 per share, in fiscal 2011, $579.8 million, or $0.98 per share, in fiscal 2010 and $548.2 million, or
$0.92 per share, in fiscal 2009. In May 2011, we declared our regular quarterly dividend for the first quarter of fiscal 2012 of $0.26 per share, which
was paid in July 2011.
In November 2000, we filed with the SEC a shelf registration statement covering 30,000,000 shares of common stock to be offered from time
to time in connection with acquisitions. As of August 17, 2011, 29,477,835 shares remained available for issuance under this registration
statement.
Short-term Borrowings
We have uncommitted bank lines of credit, which provided for unsecured borrowings for working capital of up to $95.0 million, of which
none was outstanding as of July 2, 2011 or August 17, 2011.
Our Irish subsidiary, Pallas Foods Limited, has a e10.0 million (Euro) committed facility for unsecured borrowings for working capital. There
were no borrowings outstanding under this facility as of July 2, 2011 or August 17, 2011.
On June 30, 2011, a Canadian subsidiary of Sysco entered into a short-term demand loan facility for the purpose of facilitating a distribution
from the Canadian subsidiary to Sysco, and Sysco concurrently entered into an agreement with the bank to guarantee the loan. The amount
borrowed was $182.0 million and was repaid in full on July 4, 2011.
Commercial Paper and Revolving Credit Facility
We have a Board-approved commercial paper program allowing us to issue short-term unsecured notes in an aggregate amount not to
exceed $1.3 billion.
Sysco and one of our subsidiaries, Sysco International, ULC., have a revolving credit facility supporting our U.S. and Canadian commercial
paper programs. The facility, in the amount of $1.0 billion, expires on November 4, 2012, but is subject to extension.
During fiscal 2011, 2010 and 2009, aggregate outstanding commercial paper issuances and short-term bank borrowings ranged from
approximately zero to $330.3 million, zero to $1.8 million, and zero to $165.0 million, respectively. There were no commercial paper issuances
outstanding as of July 2, 2011 and $300.0 million of commercial paper issuances outstanding as of August 17, 2011.
During fiscal 2011, 2010 and 2009, our aggregate commercial paper issuances and short-term bank borrowings had a weighted average
interest rate of 0.25%, 0.80% and 0.88%, respectively.
26