Sysco 2011 Annual Report Download - page 94
Download and view the complete annual report
Please find page 94 of the 2011 Sysco annual report below. You can navigate through the pages in the report by either clicking on the pages listed below, or by using the keyword search tool below to find specific information within the annual report.-
 1
1 -
2
-
3
-
4
-
5
-
6
-
7
-
8
-
9
-
10
-
11
-
12
-
13
-
14
-
15
-
16
-
17
-
18
-
19
-
20
-
21
-
22
-
23
-
24
-
25
-
26
-
27
-
28
-
29
-
30
-
31
-
32
-
33
-
34
-
35
-
36
-
37
-
38
-
39
-
40
-
41
-
42
-
43
-
44
-
45
-
46
-
47
-
48
-
49
-
50
-
51
-
52
-
53
-
54
-
55
-
56
-
57
-
58
-
59
-
60
-
61
-
62
-
63
-
64
-
65
-
66
-
67
-
68
-
69
-
70
-
71
-
72
-
73
-
74
-
75
-
76
-
77
-
78
-
79
-
80
-
81
-
82
-
83
-
 84
84 -
 85
85 -
 86
86 -
 87
87 -
 88
88 -
 89
89 -
 90
90 -
 91
91 -
 92
92 -
 93
93 -
 94
94 -
 95
95 -
 96
96 -
 97
97 -
 98
98 -
 99
99 -
 100
100 -
 101
101 -
 102
102 -
 103
103 -
 104
104 -
105
 |
 |

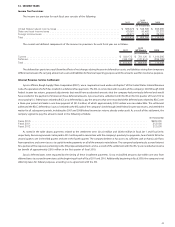
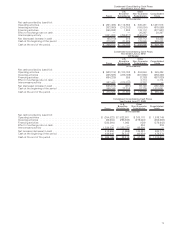
The following table sets forth the financial information for Sysco’s business segments:
2011
2010
(53 Weeks) 2009
Fiscal Year
(In thousands)
Sales:
Broadline ................................................... $ 31,945,820 $ 30,402,605 $ 29,986,585
SYGMA .................................................... 5,341,094 4,891,279 4,839,036
Other ..................................................... 2,196,863 2,090,589 2,134,708
Intersegment sales . ........................................... (160,288) (140,978) (106,999)
Total ...................................................... $ 39,323,489 $ 37,243,495 $ 36,853,330
Operating income:
Broadline ................................................... $ 2,116,130 $ 2,113,923 $ 1,996,398
SYGMA .................................................... 60,206 47,311 30,193
Other ..................................................... 92,299 84,207 64,920
Total segments............................................... 2,268,635 2,245,441 2,091,511
Corporate expenses ........................................... (337,133) (269,573) (219,300)
Total operating income ......................................... 1,931,502 1,975,868 1,872,211
Interest expense. . . ........................................... 118,267 125,477 116,322
Other expense (income), net ..................................... (14,219) 802 (14,945)
Earnings before income taxes .................................... $ 1,827,454 $ 1,849,589 $ 1,770,834
Depreciation and amortization:
Broadline ................................................... $ 292,393 $ 283,799 $ 274,268
SYGMA .................................................... 24,975 23,822 26,753
Other ..................................................... 24,494 26,229 28,887
Total segments............................................... 341,862 333,850 329,908
Corporate .................................................. 60,726 56,126 52,431
Total ...................................................... $ 402,588 $ 389,976 $ 382,339
Capital expenditures:
Broadline ................................................... $ 353,576 $ 407,808 $ 348,353
SYGMA .................................................... 38,612 25,436 5,053
Other ..................................................... 19,948 11,275 35,054
Total segments............................................... 412,136 444,519 388,460
Corporate .................................................. 224,306 150,085 76,101
Total ...................................................... $ 636,442 $ 594,604 $ 464,561
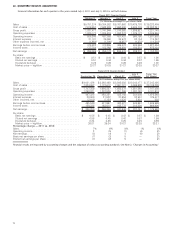
Assets:
Broadline ................................................... $ 7,240,879 $ 6,417,776 $ 5,828,384
SYGMA .................................................... 456,204 392,883 366,539
Other ..................................................... 793,341 738,814 724,378
Total segments............................................... 8,490,424 7,549,473 6,919,301
Corporate .................................................. 2,895,131 2,764,228 3,228,885
Total ...................................................... $ 11,385,555 $ 10,313,701 $ 10,148,186
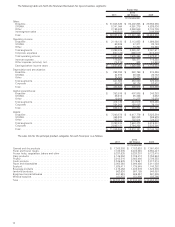
The sales mix for the principal product categories for each fiscal year is as follows:
2011
2010
(53 Weeks) 2009
(In thousands)
Canned and dry products ............................................ $ 7,308,893 $ 7,152,628 $ 7,091,420
Fresh and frozen meats ............................................. 7,163,505 6,405,820 6,394,447
Frozen fruits, vegetables, bakery and other ............................... 5,337,625 5,220,307 5,122,415
Dairy products ................................................... 4,145,350 3,709,410 3,750,684
Poultry ......................................................... 3,912,510 3,862,486 3,709,553
Fresh produce ................................................... 3,345,929 3,179,947 3,017,018
Paper and disposables .............................................. 3,055,862 2,906,426 2,911,029
Seafood ........................................................ 1,929,417 1,739,949 1,740,292
Beverage products . ............................................... 1,478,456 1,408,376 1,322,300
Janitorial products . . ............................................... 902,636 907,189 940,097
Equipment and smallwares .......................................... 581,628 599,267 661,309
Medical supplies . . . ............................................... 161,678 151,690 192,766
Total .......................................................... $39,323,489 $ 37,243,495 $ 36,853,330
70