Sysco 2011 Annual Report Download - page 58
Download and view the complete annual report
Please find page 58 of the 2011 Sysco annual report below. You can navigate through the pages in the report by either clicking on the pages listed below, or by using the keyword search tool below to find specific information within the annual report.-
 1
1 -
2
-
3
-
4
-
5
-
6
-
7
-
8
-
9
-
10
-
11
-
12
-
13
-
14
-
15
-
16
-
17
-
18
-
19
-
20
-
21
-
22
-
23
-
24
-
25
-
26
-
27
-
28
-
29
-
30
-
31
-
32
-
33
-
34
-
35
-
36
-
37
-
38
-
39
-
40
-
41
-
42
-
43
-
44
-
45
-
46
-
47
-
 48
48 -
 49
49 -
 50
50 -
 51
51 -
 52
52 -
 53
53 -
 54
54 -
 55
55 -
 56
56 -
 57
57 -
 58
58 -
 59
59 -
 60
60 -
 61
61 -
 62
62 -
 63
63 -
 64
64 -
 65
65 -
 66
66 -
 67
67 -
 68
68 -
69
-
70
-
71
-
72
-
73
-
74
-
75
-
76
-
77
-
78
-
79
-
80
-
81
-
82
-
83
-
84
-
85
-
86
-
87
-
88
-
89
-
90
-
91
-
92
-
93
-
94
-
95
-
96
-
97
-
98
-
99
-
100
-
101
-
102
-
103
-
104
-
105
 |
 |

Item 7A. Quantitative and Qualitative Disclosures About Market Risk
Interest Rate Risk
We do not utilize financial instruments for trading purposes. Our use of debt directly exposes us to interest rate risk. Floating rate debt, where
the interest rate fluctuates periodically, exposes us to short-term changes in market interest rates. Fixed rate debt, where the interest rate is fixed
over the life of the instrument, exposes us to changes in market interest rates reflected in the fair value of the debt and to the risk that we may
need to refinance maturing debt with new debt at higher rates.
We manage our debt portfolio to achieve an overall desired position of fixed and floating rates and may employ interest rate swaps as a tool
to achieve that position. The major risks from interest rate derivatives include changes in the interest rates affecting the fair value of such
instruments, potential increases in interest expense due to market increases in floating interest rates and the creditworthiness of the
counterparties in such transactions.
Fiscal 2011
As of July 2, 2011, we had no commercial paper outstanding. Total debt as of July 2, 2011 was $2.7 billion, of which approximately 75% was at
fixed rates of interest, including the impact of our interest rate swap agreements.
In fiscal 2010, we entered into two interest rate swap agreements that effectively converted $200 million of fixed rate debt maturing in fiscal
2014 (the fiscal 2014 swap) and $250 million of fixed rate debt maturing in fiscal 2013 (the fiscal 2013 swap) to floating rate debt. Both transactions
were entered into with the goal of reducing overall borrowing cost. These transactions were designated as fair value hedges since the swaps
hedge against the changes in fair value of fixed rate debt resulting from changes in interest rates.
As of July 2, 2011, the fiscal 2014 swap was recognized as an asset within the consolidated balance sheet at fair value within other assets of
$7.4 million. The fixed interest rate on the hedged debt is 4.6% and the floating interest rate on the swap is three-month LIBOR which resets
quarterly. As of July 2, 2011, the fiscal 2013 swap was recognized as an asset within the consolidated balance sheet at fair value within other assets
of $6.1 million. The fixed interest rate on the hedged debt is 4.2% and the floating interest rate on the swap is three-month LIBOR which resets
quarterly.
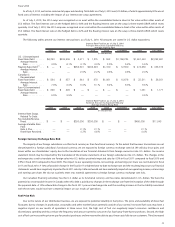
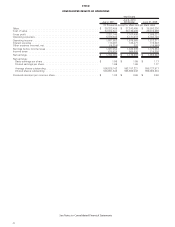
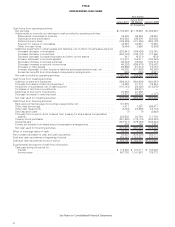
The following tables present our interest rate position as of July 2, 2011. All amounts are stated in U.S. dollar equivalents.
2012 2013 2014 2015 2016 Thereafter Total Fair Value
Interest Rate Position as of July 2, 2011
Principal Amount by Expected Maturity
Average Interest Rate
(In thousands)
U.S. $ Denominated:
Fixed Rate Debt ........ $205,616 $ 3,682 $ 1,910 $1,117 $ 632 $1,772,072 $1,985,029 $2,214,529
Average Interest Rate . . . 6.0% 4.1% 4.4% 4.4% 4.6% 5.8% 5.9%
Floating Rate Debt
(1)
..... $181,975 $253,316 $208,779 $1,100 $ — $ 12,500 $ 657,670 $ 676,075
Average Interest Rate . . . 2.0% 2.4% 1.9% 0.2% — 0.5% 2.0%
Canadian $
Denominated:
Fixed Rate Debt ........ $ 1,178 $ 1,173 $ 1,219 $1,264 $1,264 $ 19,492 $ 25,590 $ 28,549
Average Interest Rate . . . 7.7% 8.4% 8.7% 8.8% 9.3% 9.8% 9.5%
Euro cDenominated:
Fixed Rate Debt ........ $ 234 $ — $ — $ — $ — $ — $ 234 $ 261
Average Interest Rate . . . 8.9% — — — — — 8.9%
(1)
Includes fixed rate debt that has been converted to floating rate debt through interest rate swap agreements.
2012 2013 2014 2015 2016 Thereafter Total Fair Value
Interest Rate Position as of July 2, 2011
Notional Amount by Expected Maturity
Average Interest Swap Rate
(In thousands)
Interest Rate Swaps
Related To Debt:
Pay Variable/Receive
Fixed............. $ — $250,000 $200,000 $ — $ — $ — $450,000 $13,482
Average Variable Rate
Paid:
Rate A Plus ........ — 2.1% 2.1% — — — 2.1%
Fixed Rate Received . . — 4.2% 4.6% — — — 4.4%
Rate A — three-month LIBOR
34