Sysco 2011 Annual Report Download - page 22
Download and view the complete annual report
Please find page 22 of the 2011 Sysco annual report below. You can navigate through the pages in the report by either clicking on the pages listed below, or by using the keyword search tool below to find specific information within the annual report.-
 1
1 -
2
-
3
-
4
-
5
-
6
-
7
-
8
-
9
-
10
-
11
-
 12
12 -
 13
13 -
 14
14 -
 15
15 -
 16
16 -
 17
17 -
 18
18 -
 19
19 -
 20
20 -
 21
21 -
 22
22 -
 23
23 -
 24
24 -
 25
25 -
 26
26 -
 27
27 -
 28
28 -
 29
29 -
 30
30 -
 31
31 -
 32
32 -
33
-
34
-
35
-
36
-
37
-
38
-
39
-
40
-
41
-
42
-
43
-
44
-
45
-
46
-
47
-
48
-
49
-
50
-
51
-
52
-
53
-
54
-
55
-
56
-
57
-
58
-
59
-
60
-
61
-
62
-
63
-
64
-
65
-
66
-
67
-
68
-
69
-
70
-
71
-
72
-
73
-
74
-
75
-
76
-
77
-
78
-
79
-
80
-
81
-
82
-
83
-
84
-
85
-
86
-
87
-
88
-
89
-
90
-
91
-
92
-
93
-
94
-
95
-
96
-
97
-
98
-
99
-
100
-
101
-
102
-
103
-
104
-
105
 |
 |

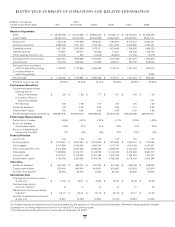
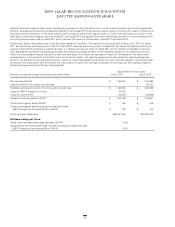
Sysco’s diluted earnings per share were impacted by a charge from the withdrawal from a multi-employer pension plan and recognized tax
benefits. Management believes that adjusting fiscal 2011’s and fiscal 2010’s diluted earnings per share to remove the impact of these items
provides a better comparison of the performance of the company’s diluted earnings per share on a year-over-year basis. As a result, in the
table below, diluted earnings per share for fiscal 2011 and fiscal 2010 are adjusted to remove the charge incurred from the withdrawal from
a multi-employer pension plan in fiscal 2011 and to remove the impact of tax benefits in fiscal 2011 and fiscal 2010.
Additionally, Sysco’s fiscal year ends on the Saturday nearest to June 30th. This resulted in a 52-week year ending July 2, 2011 for fiscal
2011 and a 53-week year ending July 3, 2010 for fiscal 2010. Because the fourth quarter of fiscal 2011 contained 13 weeks and the fourth
quarter of fiscal 2010 contained an additional week, our diluted earnings per share for fiscal 2011 are not directly comparable to the prior
year. Management believes that adjusting the fiscal 2010 diluted earnings per share for the estimated impact of the additional week pro-
vides more comparable financial results on a year-over-year basis. As a result, net earnings for fiscal 2010 presented in the table below
are adjusted by one-fourteenth of the total metric for the fourth quarter. The resulting adjustment is then applied to diluted earnings per
share for the fiscal 2010 period presented below. Failure to make these adjustments causes the year-over-year changes in diluted earnings
per share to be understated. Set forth below is a reconciliation of actual net earnings to adjusted net earnings and the resulting impact to
diluted earnings per share for the periods presented:
52/53-Week Period Ended
July 2, 2011 July 3, 2010
Net earnings (GAAP) $ 1,152,030 $ 1,179,983
Less one week fourth quarter net earnings – ( 24,127)
Subtotal excluding one week of fourth quarter net earnings $ 1,152,030 $ 1,155,856
Impact of MEPP charge (net of tax) 22,769 –
Impact of tax benefits (10,000) (28,895)
Adjusted net earnings (Non-GAAP) $ 1,164,799 $ 1,126,961
Diluted earnings per share (GAAP) $ 1.96 $ 1.99
Diluted earnings per share excluding the additional week,
MEPP charge and tax benefits (Non-GAAP) $ 1.98 $ 1.90
Diluted shares outstanding 588,691,546 593,590,042
Diluted earnings per share:
Actual year-over-year percentage decrease (GAAP) (1.5)%
Adjusted year-over-year percentage increase excluding the additional week,
MEPP charge and tax benefits (Non-GAAP) 4.2%
N-GAAP R ()
D E P S
(Dollars in thousands, except for share and per share data)
20