Sysco 2011 Annual Report Download - page 41
Download and view the complete annual report
Please find page 41 of the 2011 Sysco annual report below. You can navigate through the pages in the report by either clicking on the pages listed below, or by using the keyword search tool below to find specific information within the annual report.-
 1
1 -
2
-
3
-
4
-
5
-
6
-
7
-
8
-
9
-
10
-
11
-
12
-
13
-
14
-
15
-
16
-
17
-
18
-
19
-
20
-
21
-
22
-
23
-
24
-
25
-
26
-
27
-
28
-
29
-
30
-
 31
31 -
 32
32 -
 33
33 -
 34
34 -
 35
35 -
 36
36 -
 37
37 -
 38
38 -
 39
39 -
 40
40 -
 41
41 -
 42
42 -
 43
43 -
 44
44 -
 45
45 -
 46
46 -
 47
47 -
 48
48 -
 49
49 -
 50
50 -
 51
51 -
52
-
53
-
54
-
55
-
56
-
57
-
58
-
59
-
60
-
61
-
62
-
63
-
64
-
65
-
66
-
67
-
68
-
69
-
70
-
71
-
72
-
73
-
74
-
75
-
76
-
77
-
78
-
79
-
80
-
81
-
82
-
83
-
84
-
85
-
86
-
87
-
88
-
89
-
90
-
91
-
92
-
93
-
94
-
95
-
96
-
97
-
98
-
99
-
100
-
101
-
102
-
103
-
104
-
105
 |
 |

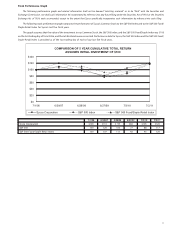
Operating Income
Cost of sales primarily includes our product costs, net of vendor consideration, and includes in-bound freight. Operating expenses include the
costs of facilities, product handling, delivery, selling and general and administrative activities. Fuel surcharges are reflected within sales and gross
profit; fuel costs are reflected within operating expenses.
Operating income decreased 2.2% in fiscal 2011 over fiscal 2010 to $1.9 billion, and as a percentage of sales, declined to 4.9% of sales. After
adjusting for the estimated impact of the 53
rd
week in fiscal 2010, the decrease in operating income in fiscal 2011 over fiscal 2010 would have
been 0.1%. This adjusted decrease was primarily driven by gross profit dollars growing at a slower rate than sales and operating expenses
increasing faster than gross profit partially due to a significant charge of $36.1 million from a withdrawal from a multi-employer pension plan.
Gross profit dollars increased 3.0% in fiscal 2011 as compared to fiscal 2010, and operating expenses increased 5.0% in fiscal 2011.
Operating income increased 5.5% in fiscal 2010 from fiscal 2009 to $2.0 billion, and as a percentage of sales, increased to 5.3% of sales. After
adjusting for the estimated impact of the 53
rd
week in fiscal 2010, the increase in operating income in fiscal 2010 over fiscal 2009 would have been
3.3%. This adjusted increase in operating income was primarily driven by a decrease in operating expenses. Gross profit dollars increased 1.0% in
fiscal 2010 as compared to fiscal 2009, while operating expenses decreased 0.6% in fiscal 2010.
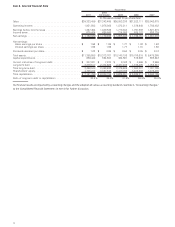
Set forth below is a reconciliation of actual operating income to adjusted operating income for the periods presented (see further discussion
at “Impact of 53-week fiscal year in Fiscal 2010” above):
2011
2010
(53 Weeks) 2009
(In thousands)
Operating income for the 53/52 week periods ........................................ $1,931,502 $1,975,868 $1,872,211
Estimated operating income for the additional week in fiscal 2010 . . . ...................... — 41,720 —
Adjusted operating income . ..................................................... $1,931,502 $1,934,148 $1,872,211
Actual percentage (decrease) increase .............................................. (2.2)% 5.5%
Adjusted percentage (decrease) increase . . . ......................................... (0.1)% 3.3%
Gross profit dollars increased in fiscal 2011 as compared to fiscal 2010 primarily due to increased sales, partially offset by the negative
comparison of the additional week included in fiscal 2010. Gross profit, as a percentage of sales, was 18.62% in fiscal 2011, a decline of 47 basis
points from the gross profit as a percentage of sales of 19.08% in fiscal 2010. This decline in gross profit percentage was primarily the result of the
following factors described in the paragraphs below.
First, Sysco’s product cost inflation was estimated as inflation of 4.6% during fiscal 2011. Based on our product sales mix for fiscal 2011, we
were most impacted by higher levels of inflation in the dairy, meat and seafood product categories in the range of 10% to 12%. Our largest selling
product category, canned and dry, experienced inflation of 4%. While we are generally able to pass through modest levels of inflation to our
customers, we were unable to pass through fully these higher levels of product cost inflation with the same gross profit percentage in these
product categories without negatively impacting our customers’ business and therefore our business. While we cannot predict whether inflation
will continue at these levels, prolonged periods of high inflation, either overall or in certain product categories, can have a negative impact on us
and our customers, as high food costs can reduce consumer spending in the food-away-from-home market, and may negatively impact our sales,
gross profit and earnings.
Second, ongoing strategic pricing initiatives in fiscal 2011 lowered our prices to our customers in certain product categories in order to
increase sales volumes. These initiatives are being phased in over time and resulted in short-term gross profit declines as a percentage of sales, but
we believe will result in long-term gross profit dollar growth due to higher sales volumes and increased market share. We have experienced
meaningful year over year volume growth with those items included in the early phases of these programs in the geographies where this program
has been implemented. We believe the long-term benefits of these strategic initiatives will result in profitable market share growth.
Third, gross profit dollars for fiscal 2011 increased as a result of higher fuel surcharges. Fuel surcharges were approximately $26.0 million
higher in fiscal 2011 than in the comparable prior year period due to higher fuel prices incurred during fiscal 2011 and the application of fuel
surcharges to a broader customer base for a small portion of the third quarter and the entire fourth quarter. Assuming that fuel prices do not
greatly vary from recent levels experienced in the second half of fiscal 2011, we expect fuel surcharges to largely offset our increased fuel costs
expected in fiscal 2012.
Gross profit dollars increased in fiscal 2010 as compared to fiscal 2009 primarily due to the additional week included in fiscal 2010. In addition,
gross profit reflected product cost deflation in fiscal 2010 as compared to product cost inflation in fiscal 2009. We may be negatively impacted by
prolonged periods of product cost deflation because a significant portion of our sales are at prices based on the cost of products sold plus a
percentage markup. As a result, our profit levels may be negatively impacted during periods of product cost deflation, even though our gross
profit percentage may remain relatively constant. Gross profit dollars for fiscal 2010 were also impacted by lower fuel surcharges. Fuel surcharges
were approximately $49.6 million lower in fiscal 2010 than fiscal 2009.
Operating expenses for fiscal 2011 increased 5.0% primarily due to higher pay-related expense, an increase in net company-sponsored
pension costs, provisions for withdrawal from multi-employer pension plans and higher fuel costs as compared to the prior year period. The
17