Sysco 2011 Annual Report Download - page 34
Download and view the complete annual report
Please find page 34 of the 2011 Sysco annual report below. You can navigate through the pages in the report by either clicking on the pages listed below, or by using the keyword search tool below to find specific information within the annual report.-
 1
1 -
2
-
3
-
4
-
5
-
6
-
7
-
8
-
9
-
10
-
11
-
12
-
13
-
14
-
15
-
16
-
17
-
18
-
19
-
20
-
21
-
22
-
23
-
 24
24 -
 25
25 -
 26
26 -
 27
27 -
 28
28 -
 29
29 -
 30
30 -
 31
31 -
 32
32 -
 33
33 -
 34
34 -
 35
35 -
 36
36 -
 37
37 -
 38
38 -
 39
39 -
 40
40 -
 41
41 -
 42
42 -
 43
43 -
 44
44 -
45
-
46
-
47
-
48
-
49
-
50
-
51
-
52
-
53
-
54
-
55
-
56
-
57
-
58
-
59
-
60
-
61
-
62
-
63
-
64
-
65
-
66
-
67
-
68
-
69
-
70
-
71
-
72
-
73
-
74
-
75
-
76
-
77
-
78
-
79
-
80
-
81
-
82
-
83
-
84
-
85
-
86
-
87
-
88
-
89
-
90
-
91
-
92
-
93
-
94
-
95
-
96
-
97
-
98
-
99
-
100
-
101
-
102
-
103
-
104
-
105
 |
 |

We are currently constructing expansions, replacement or fold-out facilities for our distribution facilities in Toronto, Ontario, Canada; Hartford,
Connecticut; Boston, Massachusetts; Lincoln, Nebraska; Jersey City, New Jersey; Syracuse, New York; Philadelphia, Pennsylvania; Austin, Texas; and
San Antonio, Texas. These operating companies, in the aggregate, accounted for approximately 9.3% of fiscal 2011 sales.
As of July 2, 2011, our fleet of approximately 8,700 delivery vehicles consisted of tractor and trailer combinations, vans and panel trucks, most
of which are either wholly or partially refrigerated for the transportation of frozen or perishable foods. We own approximately 90% of these
vehicles and lease the remainder.
Item 3. Legal Proceedings
None.
PART II
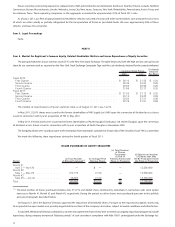
Item 5. Market for Registrant’s Common Equity, Related Stockholder Matters and Issuer Repurchases of Equity Securities
The principal market for Sysco’s common stock (SYY) is the New York Stock Exchange. The table below sets forth the high and low sales prices per
share for our common stock as reported on the New York Stock Exchange Composite Tape and the cash dividends declared for the periods indicated.
High Low
Dividends
Declared
Per Share
Common Stock Prices
Fiscal 2010:
First Quarter ......................................................... $ 26.10 $ 21.38 $ 0.24
Second Quarter ....................................................... 29.48 24.24 0.25
Third Quarter ........................................................ 29.58 26.99 0.25
Fourth Quarter ....................................................... 31.99 28.13 0.25
Fiscal 2011:
First Quarter ......................................................... $ 31.55 $ 27.13 $ 0.25
Second Quarter ....................................................... 30.18 28.22 0.26
Third Quarter ........................................................ 30.54 27.31 0.26
Fourth Quarter ....................................................... 32.76 27.81 0.26
The number of record owners of Sysco’s common stock as of August 17, 2011 was 14,210.
In May 2011, 52,070 shares were issued to the former shareholders of HRI Supply Ltd. (HRI) upon the conversion of dividend access shares
issued in connection with Sysco’s acquisition of HRI in May 2001.
In May 2011, 370,062 shares were issued to the former shareholders of North Douglas Distributors Ltd. (North Douglas) upon the conversion
of dividend access shares issued in connection with Sysco’s acquisition of North Douglas in December 2000.
The foregoing shares were issued pursuant to the exemption from registration contained in Section 4(2) of the Securities Act of 1933, as amended.
We made the following share repurchases during the fourth quarter of fiscal 2011:
ISSUER PURCHASES OF EQUITY SECURITIES
Period
(a) Total Number
of Shares Purchased
(1)
(b) Average Price
Paid per Share
(c) Total Number
of Shares
Purchased
as Part of
Publicly Announced
Plans or Programs
(d) Maximum Number
of Shares that May
Yet Be Purchased Under
the Plans or Programs
Month #1
April 3 — April 30. . . .............. — $ — — 13,386,600
Month #2
May1—May28................. 313,772 31.99 — 13,386,600
Month #3
May 29 — July 02 . . .............. 46,820 31.20 — 13,386,600
Total . . ......................... 360,592 $31.88 — 13,386,600
(1)
The total number of shares purchased includes zero, 313,772 and 46,820 shares tendered by individuals in connection with stock option
exercises in Month #1, Month #2 and Month #3, respectively. During the period, no other shares were purchased pursuant to the publicly
announced program described below.
On August 27, 2010, the Board of Directors approved the repurchase of 20,000,000 shares. Pursuant to the repurchase program, shares may
be acquired in the open market or in privately negotiated transactions at the company’s discretion, subject to market conditions and other factors.
In July 2004, the Board of Directors authorized us to enter into agreements from time to time to extend our ongoing repurchase program to include
repurchases during company announced “blackout periods” of such securities in compliance with Rule 10b5-1 promulgated under the Exchange Act.
10