Cabela's 2009 Annual Report Download - page 106
Download and view the complete annual report
Please find page 106 of the 2009 Cabela's annual report below. You can navigate through the pages in the report by either clicking on the pages listed below, or by using the keyword search tool below to find specific information within the annual report.-
 1
1 -
2
-
3
-
4
-
5
-
6
-
7
-
8
-
9
-
10
-
11
-
12
-
13
-
14
-
15
-
16
-
17
-
18
-
19
-
20
-
21
-
22
-
23
-
24
-
25
-
26
-
27
-
28
-
29
-
30
-
31
-
32
-
33
-
34
-
35
-
36
-
37
-
38
-
39
-
40
-
41
-
42
-
43
-
44
-
45
-
46
-
47
-
48
-
49
-
50
-
51
-
52
-
53
-
54
-
55
-
56
-
57
-
58
-
59
-
60
-
61
-
62
-
63
-
64
-
65
-
66
-
67
-
68
-
69
-
70
-
71
-
72
-
73
-
74
-
75
-
76
-
77
-
78
-
79
-
80
-
81
-
82
-
83
-
84
-
85
-
86
-
87
-
88
-
89
-
90
-
91
-
92
-
93
-
94
-
95
-
 96
96 -
 97
97 -
 98
98 -
 99
99 -
 100
100 -
 101
101 -
 102
102 -
 103
103 -
 104
104 -
 105
105 -
 106
106 -
 107
107 -
 108
108 -
 109
109 -
 110
110 -
 111
111 -
 112
112 -
 113
113 -
 114
114 -
 115
115 -
 116
116 -
117
-
118
-
119
-
120
-
121
-
122
-
123
-
124
-
125
-
126
-
127
-
128
-
129
-
130
-
131
 |
 |

97
CABELA’S INCORPORATED AND SUBSIDIARIES
NOTES TO CONSOLIDATED FINANCIAL STATEMENTS
(Dollars in Thousands Except Share and Per Share Amounts)
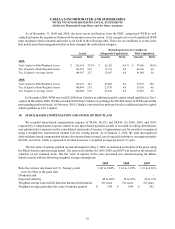
As of December 31, 2009 and 2008, the most recent notification from the FDIC categorized WFB as well
capitalized under the regulatory framework for prompt corrective action. To be categorized as well capitalized WFB
must maintain certain amounts and ratios as set forth in the following table. There are no conditions or events since
that notification that management believes have changed the institution’s category.
Ratio Required to be Considered
Actual Adequately-Capitalized Well-Capitalized
Amount Ratio Amount Ratio Amount Ratio
2009:
Total Capital to Risk-Weighted Assets $ 216,634 27.8 % $ 62,421 8.0 % $ 78,026 10.0%
Tier I Capital to Risk-Weighted Assets 194,587 24.9 31,211 4.0 46,816 6.0
Tier I Capital to Average Assets 194,587 23.7 32,847 4.0 41,058 5.0
2008:
Total Capital to Risk-Weighted Assets 166,611 28.1 47,460 8.0 59,325 10.0
Tier I Capital to Risk-Weighted Assets 140,886 23.8 23,730 4.0 35,595 6.0
Tier I Capital to Average Assets 140,886 23.6 23,842 4.0 29,803 5.0
In December 2009, WFB received $25,000 from Cabela’s as additional paid-in capital which qualified as Tier 1
capital. In December 2008, WFB received $25,000 from Cabela’s in exchange for 250,000 shares of WFB convertible
participating preferred stock. In February 2010, Cabela’s converted this preferred stock to additional paid-in capital
which qualifies as Tier 1 capital.
18. STOCK BASED COMPENSATION AND STOCK OPTION PLANS
We recorded share-based compensation expense of $9,410, $6,535, and $4,944, for 2009, 2008, and 2007,
respectively. Compensation expense related to our share-based payment awards is recorded in selling, distribution,
and administrative expenses in the consolidated statements of income. Compensation cost for awards is recognized
using a straight-line amortization method over the vesting period. As of January 2, 2010, the total unrecognized
deferred share-based compensation balance for unvested shares issued, net of expected forfeitures, was approximately
$12,041, net of tax, which is expected to be amortized over a weighted average period of 1.9 years.
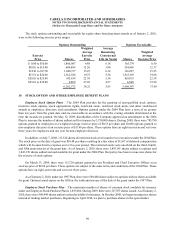
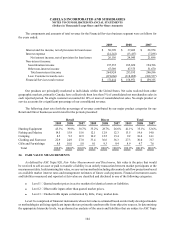
The fair value of options granted on and subsequent to May 1, 2004, is estimated on the date of the grant using
the Black-Scholes option pricing model. The expected volatility for 2009, 2008, and 2007 was based on the historical
volatility of our common stock. The fair value of options in the years presented was estimated using the Black-
Scholes model with the following weighted average assumptions:
2009 2008 2007
Risk-free interest rate based on U.S. Treasury yield 1.86 to 2.48 % 1.34 to 3.22 % 3.31 to 4.63 %
curve in effect at the grant date
Dividend yield - - -
Expected volatility 45 to 46% 35 to 43% 30 to 33%
Weighted average expected life based on historical information 5.0 years 5.0 years 5.0 years
Weighted average grant date fair value of options granted $ 7.94 $5.49 $7.82