Cabela's 2009 Annual Report Download - page 54
Download and view the complete annual report
Please find page 54 of the 2009 Cabela's annual report below. You can navigate through the pages in the report by either clicking on the pages listed below, or by using the keyword search tool below to find specific information within the annual report.-
 1
1 -
2
-
3
-
4
-
5
-
6
-
7
-
8
-
9
-
10
-
11
-
12
-
13
-
14
-
15
-
16
-
17
-
18
-
19
-
20
-
21
-
22
-
23
-
24
-
25
-
26
-
27
-
28
-
29
-
30
-
31
-
32
-
33
-
34
-
35
-
36
-
37
-
38
-
39
-
40
-
41
-
42
-
43
-
 44
44 -
 45
45 -
 46
46 -
 47
47 -
 48
48 -
 49
49 -
 50
50 -
 51
51 -
 52
52 -
 53
53 -
 54
54 -
 55
55 -
 56
56 -
 57
57 -
 58
58 -
 59
59 -
 60
60 -
 61
61 -
 62
62 -
 63
63 -
 64
64 -
65
-
66
-
67
-
68
-
69
-
70
-
71
-
72
-
73
-
74
-
75
-
76
-
77
-
78
-
79
-
80
-
81
-
82
-
83
-
84
-
85
-
86
-
87
-
88
-
89
-
90
-
91
-
92
-
93
-
94
-
95
-
96
-
97
-
98
-
99
-
100
-
101
-
102
-
103
-
104
-
105
-
106
-
107
-
108
-
109
-
110
-
111
-
112
-
113
-
114
-
115
-
116
-
117
-
118
-
119
-
120
-
121
-
122
-
123
-
124
-
125
-
126
-
127
-
128
-
129
-
130
-
131
 |
 |

45
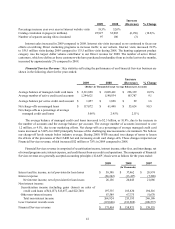
Significant selling, distribution, and administrative expense increases and decreases related to specific business
segments included the following:
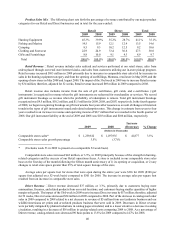
Retail Business Segment:
• An increase in existing retail store operating costs of $11 million over 2008.
• Additional operating costs for new stores that were not open in 2008 of $8 million, including $5 million in
employee compensation and benefit costs.
• A decrease in comparable store employee compensation and benefits of $7 million realized from our focus
to enhance our retail store efficiencies.
• An increase in depreciation on stores of $4 million over 2008.
• New store pre-opening costs of $4 million, a decrease of $5 million compared to 2008.
• Improved efficiencies in advertising resulting in a decrease of $4 million in advertising and promotional costs.
• An increase in marketing fees of $3 million received from the Financial Services segment.
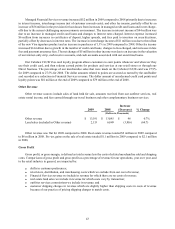
Direct Business Segment:
• A net decrease in catalog and Internet related marketing costs of $16 million compared to 2008 primarily
due to a managed reduction in catalog page count and lower circulation.
• A decrease of $3 million in employee compensation and benefits.
• An increase in marketing fees of $1 million received from the Financial Services segment.
Financial Services:
• An increase of $4 million in the marketing fee paid by the Financial Services segment to the Direct business
segment ($1 million) and the Retail segment ($3 million).
• An increase in third party processing fees of $1 million due to an increase in the volume of transactions.
• An increase in professional fees of $2 million due to higher amortization of fees related to recently
completed securitizations and to increases in Federal Deposit Insurance Corporation (“FDIC”) assessments
and consulting fees.
• An increase in compensation and benefits of $2 million.
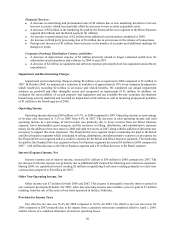
Corporate Overhead, Distribution Centers, and Other:
• An increase of $9 million in employee compensation and benefits primarily due to an increase in incentive
compensation of $12 million compared to 2008.
• An increase of $2 million in costs for professional services.
• A net increase of $1 million in depreciation expense, and equipment and software expenses.
Restructuring and Impairment Charges
Impairment and restructuring charges were classified as follows for the years ended:
2009 2008
Impairment losses on:
Property and equipment $ 43,721 $1,632
Land held for sale 16,046 854
Economic development bonds 2,099 558
Goodwill and other intangible assets 460 1,070
62,326 4,114
Restructuring charges for:
Severance and related benefits 4,468 1,670
Total $66,794 $5,784