Cabela's 2009 Annual Report Download - page 96
Download and view the complete annual report
Please find page 96 of the 2009 Cabela's annual report below. You can navigate through the pages in the report by either clicking on the pages listed below, or by using the keyword search tool below to find specific information within the annual report.-
 1
1 -
2
-
3
-
4
-
5
-
6
-
7
-
8
-
9
-
10
-
11
-
12
-
13
-
14
-
15
-
16
-
17
-
18
-
19
-
20
-
21
-
22
-
23
-
24
-
25
-
26
-
27
-
28
-
29
-
30
-
31
-
32
-
33
-
34
-
35
-
36
-
37
-
38
-
39
-
40
-
41
-
42
-
43
-
44
-
45
-
46
-
47
-
48
-
49
-
50
-
51
-
52
-
53
-
54
-
55
-
56
-
57
-
58
-
59
-
60
-
61
-
62
-
63
-
64
-
65
-
66
-
67
-
68
-
69
-
70
-
71
-
72
-
73
-
74
-
75
-
76
-
77
-
78
-
79
-
80
-
81
-
82
-
83
-
84
-
85
-
 86
86 -
 87
87 -
 88
88 -
 89
89 -
 90
90 -
 91
91 -
 92
92 -
 93
93 -
 94
94 -
 95
95 -
 96
96 -
 97
97 -
 98
98 -
 99
99 -
 100
100 -
 101
101 -
 102
102 -
 103
103 -
 104
104 -
 105
105 -
 106
106 -
107
-
108
-
109
-
110
-
111
-
112
-
113
-
114
-
115
-
116
-
117
-
118
-
119
-
120
-
121
-
122
-
123
-
124
-
125
-
126
-
127
-
128
-
129
-
130
-
131
 |
 |

87
CABELA’S INCORPORATED AND SUBSIDIARIES
NOTES TO CONSOLIDATED FINANCIAL STATEMENTS
(Dollars in Thousands Except Share and Per Share Amounts)
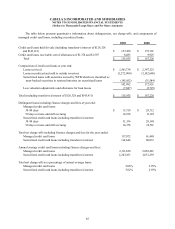
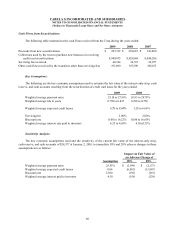
The sensitivity analysis is hypothetical and is as of a specific point in time. As a result, these scenarios should
be used with caution. As the table indicates, changes in fair value based on 10% variation in assumptions generally
cannot be extrapolated because the relationship of the change in assumption to the change in fair value may not be
linear. Also, in this table, the effect of a variation in a particular assumption on the fair values of the retained interests
are calculated without changing any other assumption; in reality, changes in one factor may result in changes in
another, which might magnify or counteract the sensitivities. In addition, the sensitivity analysis does not consider
any corrective action that WFB may take to mitigate the impact of any adverse changes in the key assumptions.
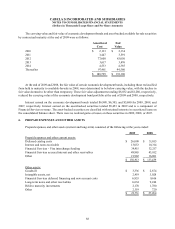
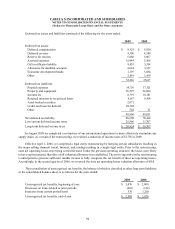
4. PROPERTY AND EQUIPMENT
Property and equipment included the following at the years ended:
Depreciable Life
in Years 2009 2008
Land and improvements Up to 20 $164,284 $158,742
Buildings and improvements 7 to 40 494,600 492,135
Furniture, fixtures and equipment 3 to 15 400,860 424,640
Assets held under capital lease Up to 30 14,562 14,562
Property and equipment 1,074,306 1,090,079
Less accumulated depreciation and amortization (302,962)(302,575)
771,344 787,504
Construction in progress 40,421 93,576
$811,765 $881,080
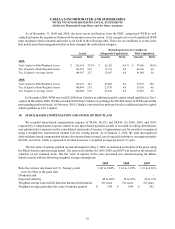
5. SECURITIES
Economic development bonds and asset-backed available-for-sale securities consisted of the following for the
years ended:
Cost
Gross
Unrealized
Gains
Gross
Unrealized
Losses Fair
Value
2009:
Available-for-sale securities:
Economic development bonds $ 111,815 $999 $(4,323) $ 108,491
Asset-backed securities 76,984 5,721 -82,705
$188,799 $6,720 $(4,323) $ 191,196
2008:
Available-for-sale securities:
Economic development bonds $ 122,501 $35 $(9,951) $ 112,585