Cabela's 2009 Annual Report Download - page 51
Download and view the complete annual report
Please find page 51 of the 2009 Cabela's annual report below. You can navigate through the pages in the report by either clicking on the pages listed below, or by using the keyword search tool below to find specific information within the annual report.-
 1
1 -
2
-
3
-
4
-
5
-
6
-
7
-
8
-
9
-
10
-
11
-
12
-
13
-
14
-
15
-
16
-
17
-
18
-
19
-
20
-
21
-
22
-
23
-
24
-
25
-
26
-
27
-
28
-
29
-
30
-
31
-
32
-
33
-
34
-
35
-
36
-
37
-
38
-
39
-
40
-
 41
41 -
 42
42 -
 43
43 -
 44
44 -
 45
45 -
 46
46 -
 47
47 -
 48
48 -
 49
49 -
 50
50 -
 51
51 -
 52
52 -
 53
53 -
 54
54 -
 55
55 -
 56
56 -
 57
57 -
 58
58 -
 59
59 -
 60
60 -
 61
61 -
62
-
63
-
64
-
65
-
66
-
67
-
68
-
69
-
70
-
71
-
72
-
73
-
74
-
75
-
76
-
77
-
78
-
79
-
80
-
81
-
82
-
83
-
84
-
85
-
86
-
87
-
88
-
89
-
90
-
91
-
92
-
93
-
94
-
95
-
96
-
97
-
98
-
99
-
100
-
101
-
102
-
103
-
104
-
105
-
106
-
107
-
108
-
109
-
110
-
111
-
112
-
113
-
114
-
115
-
116
-
117
-
118
-
119
-
120
-
121
-
122
-
123
-
124
-
125
-
126
-
127
-
128
-
129
-
130
-
131
 |
 |

42
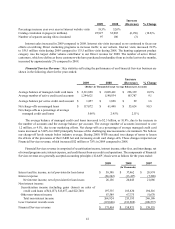
Financial Services revenue increased 7.8% in 2009 compared to 2008. Credit card loans securitized and sold
are removed from our consolidated balance sheet, and the net earnings on these securitized assets, after paying costs
associated with outside investors, are reflected as a component of our securitization income shown above on a GAAP
basis. Net interest income includes operating results on the credit card loans receivable we own. Interest and fee income
increased $13 million primarily due to changes in interest rates charged to cardholders, changes to fees charged, and
increases in late fees. In addition, net interest income, securitization income, and other non-interest income are affected
by changes in the transferor’s interest included in our credit card loans receivable. Interest expense increased $11
million primarily due to increases in certificates of deposit compared to 2008. Other non-interest income includes
securitization income, gains and losses on sales of loans, and income recognized on our retained interests, as well
as interchange income on the entire managed portfolio. Securitization income increased $11 million from 2008 due
primarily to changes in the valuation of our interest-only strip, cash reserve accounts, and cash accounts associated with
our securitized loans, and increases to excess spread from reductions in our interest paid to outside investors, higher
portfolio yield, and interchange on the securitized credit card loans. Customer rewards costs increased $1 million from
continued growth in the Cabela’s CLUB Visa card usage by our customers due to increases in credit card purchases of
1.3% and changes to customer rewards marketing programs utilized comparing the respective years.
Managed credit card loans of the Financial Services business segment include both credit card loans receivable
we own and securitized credit card loans in a separate trust that is not consolidated in our financial statements.
The process by which credit card loans are securitized converts interest income, interchange income, credit card
fees, credit losses, and other income and expenses on the securitized loans into securitization income. Because the
financial performance of the total managed portfolio has a significant impact on earnings we receive from servicing
the portfolio, management believes that evaluating the components of our Financial Services revenue for both owned
loans and securitized loans, as presented below in the non-GAAP presentation, is important to analyzing results.
Non-GAAP Presentation – The non-GAAP presentation shown below presents the financial performance of the
total managed portfolio of credit card loans. Although our consolidated financial statements are not presented in this
manner, we review the performance of the managed portfolio as presented below. Interest income, interchange income
(net of customer rewards), and fee income on both the owned and securitized portfolio are reflected in the respective line
items. Interest paid to outside investors on the securitized credit card loans is included in interest expense. Credit losses
on the entire managed portfolio are reflected in the provision for loan losses. This non-GAAP presentation includes
income derived from the valuation of our interest-only strip, cash reserve accounts, and cash accounts associated with
our securitized loans that would generally be reversed or not reported in a managed presentation.
The following table sets forth the revenue components of our Financial Services segment managed portfolio on
a non-GAAP basis for the years ended:
2009 2008 2007
(Dollars in Thousands)
Interest income $ 247,096 $ 202,877 $ 186,341
Interchange income, net of customer rewards costs 86,796 75,827 62,066
Other fee income 52,279 37,806 27,233
Interest expense (96,253)(89,862) (83,120)
Provision for loan losses (120,132) (64,003)(35,415)
Other 1,628 (3,674)2,230
Managed Financial Services revenue $ 171,414 $158,971 $159,335
Managed Financial Services Revenue as a Percentage of Average Managed Credit Card Loans:
Interest income 10.7%9.7%11.0%
Interchange income, net of customer rewards costs 3.7 3.6 3.7
Other fee income 2.3 1.9 1.6
Interest expense (4.2)(4.3)(4.9)
Provision for loan losses (5.2)(3.1)(2.1)
Other 0.1 (0.2)0.1
Managed Financial Services revenue 7.4%7.6%9.4%