Cabela's 2009 Annual Report Download - page 56
Download and view the complete annual report
Please find page 56 of the 2009 Cabela's annual report below. You can navigate through the pages in the report by either clicking on the pages listed below, or by using the keyword search tool below to find specific information within the annual report.-
 1
1 -
2
-
3
-
4
-
5
-
6
-
7
-
8
-
9
-
10
-
11
-
12
-
13
-
14
-
15
-
16
-
17
-
18
-
19
-
20
-
21
-
22
-
23
-
24
-
25
-
26
-
27
-
28
-
29
-
30
-
31
-
32
-
33
-
34
-
35
-
36
-
37
-
38
-
39
-
40
-
41
-
42
-
43
-
44
-
45
-
 46
46 -
 47
47 -
 48
48 -
 49
49 -
 50
50 -
 51
51 -
 52
52 -
 53
53 -
 54
54 -
 55
55 -
 56
56 -
 57
57 -
 58
58 -
 59
59 -
 60
60 -
 61
61 -
 62
62 -
 63
63 -
 64
64 -
 65
65 -
 66
66 -
67
-
68
-
69
-
70
-
71
-
72
-
73
-
74
-
75
-
76
-
77
-
78
-
79
-
80
-
81
-
82
-
83
-
84
-
85
-
86
-
87
-
88
-
89
-
90
-
91
-
92
-
93
-
94
-
95
-
96
-
97
-
98
-
99
-
100
-
101
-
102
-
103
-
104
-
105
-
106
-
107
-
108
-
109
-
110
-
111
-
112
-
113
-
114
-
115
-
116
-
117
-
118
-
119
-
120
-
121
-
122
-
123
-
124
-
125
-
126
-
127
-
128
-
129
-
130
-
131
 |
 |
47
merchandise gross margin. These decreases were partially offset by increases in revenue from our Retail business and
Financial Services segments, a decrease in catalog and Internet related marketing costs due to a managed reduction
in catalog page count, and improved efficiencies in compensation and advertising in our Retail business. Operating
income for 2008 also includes income of $8.7 million from gift instrument breakage previously described.
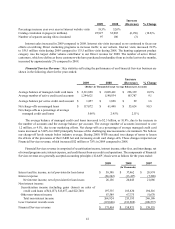
Under a contractual arrangement, the Financial Services segment incurs a marketing fee paid to the Retail
and Direct business segments. The marketing fee was calculated based on the terms of the contractual arrangement
and was consistently applied to both years presented. It is included in selling, distribution, and administrative
expenses as an expense for the Financial Services segment and as a credit to expense for the Retail and Direct
business segments. The marketing fee paid by the Financial Services segment to these two business segments
increased $4 million for 2009 compared to 2008 – a $3 million increase to the Retail segment and a $1 million
increase to the Direct business segment.
Interest (Expense) Income, Net
Interest expense, net of interest income, decreased $7 million to $23 million in 2009 compared to 2008. The net
decrease in interest expense was primarily due to a lower average balance of debt outstanding from managed debt
reduction and lower weighted average interest rates in 2009 compared to 2008. During 2009, we capitalized interest
totaling $0.2 million on qualifying fixed assets compared to $2 million for 2008.
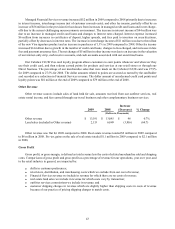
Other Non-Operating Income, Net
Other income was $7 million for both 2009 and 2008. Other non-operating income primarily represents interest
earned on our economic development bonds.
Provision for Income Taxes
Our effective tax rate was 35.2% in 2009 compared to 35.4% in 2008. The effective tax rate for 2009 was
reduced primarily by our international restructuring completed in August 2009. The effective tax rate for 2008 was
impacted by the corporate restructure completed in April 2008 and the release of valuation allowances relating to
state net operating losses realized in 2008.