Cabela's 2009 Annual Report Download - page 61
Download and view the complete annual report
Please find page 61 of the 2009 Cabela's annual report below. You can navigate through the pages in the report by either clicking on the pages listed below, or by using the keyword search tool below to find specific information within the annual report.-
 1
1 -
2
-
3
-
4
-
5
-
6
-
7
-
8
-
9
-
10
-
11
-
12
-
13
-
14
-
15
-
16
-
17
-
18
-
19
-
20
-
21
-
22
-
23
-
24
-
25
-
26
-
27
-
28
-
29
-
30
-
31
-
32
-
33
-
34
-
35
-
36
-
37
-
38
-
39
-
40
-
41
-
42
-
43
-
44
-
45
-
46
-
47
-
48
-
49
-
50
-
 51
51 -
 52
52 -
 53
53 -
 54
54 -
 55
55 -
 56
56 -
 57
57 -
 58
58 -
 59
59 -
 60
60 -
 61
61 -
 62
62 -
 63
63 -
 64
64 -
 65
65 -
 66
66 -
 67
67 -
 68
68 -
 69
69 -
 70
70 -
 71
71 -
72
-
73
-
74
-
75
-
76
-
77
-
78
-
79
-
80
-
81
-
82
-
83
-
84
-
85
-
86
-
87
-
88
-
89
-
90
-
91
-
92
-
93
-
94
-
95
-
96
-
97
-
98
-
99
-
100
-
101
-
102
-
103
-
104
-
105
-
106
-
107
-
108
-
109
-
110
-
111
-
112
-
113
-
114
-
115
-
116
-
117
-
118
-
119
-
120
-
121
-
122
-
123
-
124
-
125
-
126
-
127
-
128
-
129
-
130
-
131
 |
 |

52
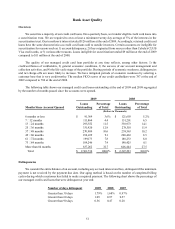
Charge-offs
Charge-offs consist of the uncollectible principal, interest, and fees on a customer’s account. Recoveries are the
amounts collected on previously charged-off accounts. Most bankcard issuers charge-off accounts at 180 days. We
charge off credit card loans on a daily basis after an account becomes at a minimum 130 days contractually delinquent
to allow us to manage the collection process more efficiently. Accounts relating to cardholder bankruptcies, cardholder
deaths, and fraudulent transactions are charged off earlier. Our charge-off activity for the managed portfolio is
summarized below for the years ended:
2009 2008 2007
(Dollars in Thousands)
Charge-offs $127,539 $70,944 $42,853
Recoveries (10,467)(9,496)(8,955)
Net charge-offs $ 117,072 $61,448 $33,898
Net charge-offs as a percentage of average
managed credit card loans 5.06%2.95%2.01%
For 2009, net charge-offs as a percentage of average managed credit card loans increased to 5.06%, up 211 basis
points compared to 2.95% for 2008, principally because of the challenging economic environment. We believe our
charge-off levels remain below industry average.
Liquidity and Capital Resources
Overview
We believe that we will have sufficient capital available from cash on hand, our revolving credit facility, and
other borrowing sources to fund our foreseeable cash requirements and near-term growth plans. At the end of 2009
and 2008, cash on a consolidated basis totaled $582 million and $410 million, respectively, of which $371 million and
$402 million, respectively, was cash at our Financial Services business segment which will be utilized to meet this
segment’s liquidity requirements. In 2009, our Financial Services business completed a term securitization totaling
$500 million, renewed and increased a $214 million variable funding facility to $260 million, and renewed and
increased a $376 million variable funding facility to $412 million. We will continue to evaluate additional funding
sources to determine the most cost effective source of funds for our Financial Services business segment. These
potential sources include, among others, certificates of deposit and securitizations.
Our Retail and Direct business segments and our Financial Services business segment have significantly
differing liquidity and capital needs. The primary cash requirements of our merchandising business relate to capital
for new retail stores, purchases of inventory, investments in our management information systems and infrastructure,
purchases of economic development bonds related to the construction of new retail stores, and general working capital
needs. We historically have met these requirements with cash generated from our merchandising business operations,
borrowing under revolving credit facilities, issuing debt and equity securities, obtaining economic development
grants from state and local governments in connection with developing our retail stores, collecting principal and
interest payments on our economic development bonds, and from the retirement of economic development bonds.
Retail and Direct Business Segments – The cash flow we generate from our merchandising business is
seasonal, with our peak cash requirements for inventory occurring from April through November. While we have
consistently generated overall positive annual cash flow from our operating activities, other sources of liquidity are
required by our merchandising business during these peak cash use periods. These sources historically have included
short-term borrowings under our revolving credit facility and access to debt markets. While we generally have been