Cabela's 2009 Annual Report Download - page 3
Download and view the complete annual report
Please find page 3 of the 2009 Cabela's annual report below. You can navigate through the pages in the report by either clicking on the pages listed below, or by using the keyword search tool below to find specific information within the annual report.-
 1
1 -
 2
2 -
 3
3 -
 4
4 -
 5
5 -
 6
6 -
 7
7 -
 8
8 -
 9
9 -
 10
10 -
 11
11 -
 12
12 -
 13
13 -
 14
14 -
15
-
16
-
17
-
18
-
19
-
20
-
21
-
22
-
23
-
24
-
25
-
26
-
27
-
28
-
29
-
30
-
31
-
32
-
33
-
34
-
35
-
36
-
37
-
38
-
39
-
40
-
41
-
42
-
43
-
44
-
45
-
46
-
47
-
48
-
49
-
50
-
51
-
52
-
53
-
54
-
55
-
56
-
57
-
58
-
59
-
60
-
61
-
62
-
63
-
64
-
65
-
66
-
67
-
68
-
69
-
70
-
71
-
72
-
73
-
74
-
75
-
76
-
77
-
78
-
79
-
80
-
81
-
82
-
83
-
84
-
85
-
86
-
87
-
88
-
89
-
90
-
91
-
92
-
93
-
94
-
95
-
96
-
97
-
98
-
99
-
100
-
101
-
102
-
103
-
104
-
105
-
106
-
107
-
108
-
109
-
110
-
111
-
112
-
113
-
114
-
115
-
116
-
117
-
118
-
119
-
120
-
121
-
122
-
123
-
124
-
125
-
126
-
127
-
128
-
129
-
130
-
131
 |
 |

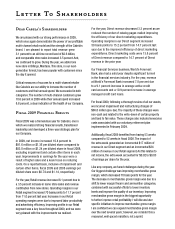
Dear Cabela’s Shareholders:
We are pleased with our strong performance in 2009,
which once again demonstrates the power of our profi table
multi-channel retail model and the strength of the Cabela’s
brand. I am pleased to report total revenue grew
3.1 percent to an all-time record level of $2.6 billion,
and comparable store sales increased 3.5 percent. And,
we continued to grow. During the year, we added one
new store in Billings, Montana. This store, in our next-
generation format, has been popular with customers since
the day it opened.
Critical measures of success for a multi-channel retailer
like Cabela’s are our ability to increase the number of
customers and their annual spend. We succeeded in both
categories. The number of multi-channel customers grew
10.6 percent in 2009 while their annual spend increased
8.8 percent, a clear indication of the health of our Company.
Fiscal 2009 Financial Results
Fiscal 2009 was a tremendous year for Cabela’s, one in
which we realized strong fi nancial results, transitioned
leadership and developed a three-year strategic plan for
our Company.
For the year, Retail revenue increased 8.1 percent due to
a 3.5 percent increase in same store sales and revenue
contribution from new stores. Operating margins in our
Retail segment increased 70 basis points to 11.7 percent
from 11.0 percent last year. Increases in our Retail
operating margins were due to improved labor productivity
and advertising effi ciency. Improving profi ts in our Retail
segment was a key focus throughout 2009, and we were
very pleased with the improvements we realized.
Additionally, fi scal 2009 benefi ted from having 53 weeks
compared to 52 weeks in fi scal 2008. The impact of
the extra week generated an incremental $17 million of
revenue in our Direct segment and an incremental $34
million of revenue in our Retail segment. As this relates to
net income, the extra week accounted for $0.02 to $0.03
of earnings per share for the year.
Like any company, we faced challenges during the year.
Our biggest challenge was improving merchandise gross
margin, which decreased 70 basis points for the year.
The decrease in merchandise gross margin was due to a
shift to lower margin fi rearm and ammunition categories,
combined with successful efforts to lower inventory
levels and improve the quality of our inventory. Improving
merchandise gross margin is the biggest opportunity
to further improve retail profi tability. I will discuss later
specifi c initiatives to improve merchandise gross margin.
I am confi dent we can expand merchandise gross margin
over the next several years; however, we consider this a
measured, well-paced marathon, not a sprint.
Letter To Shareholders
For the year, Direct revenue decreased 3.3 percent as we
reduced the number of catalog pages mailed improving
the efficiency of our direct marketing expenditures.
Operating margins in our Direct segment increased
50 basis points to 15.2 percent from 14.7 percent last
year due to the improved efficiency of direct marketing
expenditures. Direct marketing costs were 13.8 percent
of Direct revenue compared to 14.7 percent of Direct
revenue in the prior year.
Our Financial Services business, World’s Foremost
Bank, also had a solid year despite significant turmoil
in the financial services industry. For the year, revenue
at World’s Foremost Bank increased 7.8 percent due
to a 9.1 percent increase in average active credit
card accounts and a 10.9 percent increase in average
managed credit card loans.
For fiscal 2009, following a thorough review of all our assets,
we incurred impairment and restructuring charges of
$66.8 million (pre-tax). The majority of these charges were
non-cash and related to the write-down of certain property
and land to fair value. These charges also included severance
costs associated with our voluntary retirement plan
implemented in February 2009.
In 2009, net income increased 10.4 percent to
$91.6 million or $1.36 per diluted share compared to
$83.0 million or $1.24 per diluted share in fiscal 2008,
excluding impairment and certain other items in each
year. Improvements in earnings for the year were a
result of higher sales and a keen focus on reducing
costs. On a reported basis, inclusive of impairment and
certain other items, fiscal 2009 and 2008 earnings per
diluted share were $0.74 and $1.14, respectively.