Cabela's 2009 Annual Report Download - page 67
Download and view the complete annual report
Please find page 67 of the 2009 Cabela's annual report below. You can navigate through the pages in the report by either clicking on the pages listed below, or by using the keyword search tool below to find specific information within the annual report.-
 1
1 -
2
-
3
-
4
-
5
-
6
-
7
-
8
-
9
-
10
-
11
-
12
-
13
-
14
-
15
-
16
-
17
-
18
-
19
-
20
-
21
-
22
-
23
-
24
-
25
-
26
-
27
-
28
-
29
-
30
-
31
-
32
-
33
-
34
-
35
-
36
-
37
-
38
-
39
-
40
-
41
-
42
-
43
-
44
-
45
-
46
-
47
-
48
-
49
-
50
-
51
-
52
-
53
-
54
-
55
-
56
-
 57
57 -
 58
58 -
 59
59 -
 60
60 -
 61
61 -
 62
62 -
 63
63 -
 64
64 -
 65
65 -
 66
66 -
 67
67 -
 68
68 -
 69
69 -
 70
70 -
 71
71 -
 72
72 -
 73
73 -
 74
74 -
 75
75 -
 76
76 -
 77
77 -
78
-
79
-
80
-
81
-
82
-
83
-
84
-
85
-
86
-
87
-
88
-
89
-
90
-
91
-
92
-
93
-
94
-
95
-
96
-
97
-
98
-
99
-
100
-
101
-
102
-
103
-
104
-
105
-
106
-
107
-
108
-
109
-
110
-
111
-
112
-
113
-
114
-
115
-
116
-
117
-
118
-
119
-
120
-
121
-
122
-
123
-
124
-
125
-
126
-
127
-
128
-
129
-
130
-
131
 |
 |
58
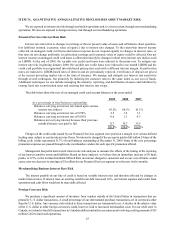
Financing Activities – Cash provided by financing activities decreased $36 million for 2008 compared to 2007.
This net decrease between years from financing activities was due to a net change in WFB’s short-term borrowings of
$200 million primarily from the repayment of a variable funding facility credit agreement and a net decrease of $87
million in borrowings primarily on lines of credit for working capital and inventory financing. In addition, long-term
debt decreased $26 million comparing years due to prepayment of debt at the end of 2008. Partially offsetting these
decreases was an increase of $326 million in time deposits at the end of 2008 compared to 2007, which WFB utilized
to help fund its credit card operations, resulting in a net change in cash flows of $267 million between years.
Grants and Economic Development Bonds
In the past, we have negotiated economic development arrangements relating to the construction of a number
of our new retail stores, including free land, monetary grants, and the recapture of incremental sales, property, or
other taxes through economic development bonds, with many local and state governments. We design our retail
stores to provide exciting tourist and entertainment shopping experiences for the entire family. Our retail stores also
employ many people from the local community, draw customer traffic from a broad geographic range, and serve as a
catalyst for the opening of additional retail businesses such as restaurants, hotels, and gas stations in the surrounding
areas. We believe these factors increase the revenue for the state and the local municipality where the retail store is
located, making us a compelling partner for community development and expansion. Where appropriate, we intend
to continue to utilize economic development arrangements with state and local governments to offset some of the
construction costs and improve the return on investment of our new retail stores.
Economic Development Bonds – Through economic development bonds, the state or local government sells
bonds to provide funding for land acquisition, readying the site, building infrastructure and related eligible expenses
associated with the construction and equipping of our retail stores. In the past, we have primarily been the sole
purchaser of these bonds. The bond proceeds that are received by the governmental entity are then used to fund
the construction and equipping of new retail stores and related infrastructure development. While purchasing these
bonds involves an initial cash outlay by us in connection with a new store, some or all of these costs can be recaptured
through the repayments of the bonds. The payments of principal and interest on the bonds are typically tied to
sales, property, or lodging taxes generated from the store and, in some cases, from businesses in the surrounding
area, over periods which range between 20 and 30 years. In addition, some of the bonds that we have purchased
may be repurchased for par value by the governmental entity prior to the maturity date of the bonds. However, the
governmental entity from which we purchase the bonds is not otherwise liable for repayment of principal and interest
on the bonds to the extent that the associated taxes are insufficient to pay the bonds.
After purchasing the bonds, we typically record them on our consolidated balance sheet classified as “available
for sale” and value them based upon management’s projections of the amount of tax revenue expected to be generated
to support principal and interest payments on the bonds. Because of the unique features of each project, there is no
independent market data for valuation of these types of bonds. If sufficient tax revenue is not generated by the subject
properties, we will not receive scheduled payments and will be unable to realize the full value of the bonds carried
on our consolidated balance sheet. At January 2, 2010, and December 27, 2008, economic development bonds totaled
$108 million and $113 million, respectively.
The negotiation of these economic development arrangements has been important to our retail store expansion
in the past, and these arrangements may be an important factor in our retail store expansion strategy in certain
locations because they allow us to avoid or recapture a portion of the costs involved with opening a new store.
Grants – We generally have received grant funding in exchange for commitments made by us to the state or
local government providing the funding. The commitments, such as assurance of agreed employment and wage
levels at our retail stores or that the retail store will remain open, typically phase out over approximately five to ten
years. If we fail to maintain the commitments during the applicable period, the funds we received may have to be
repaid or other adverse consequences may arise, which could affect our cash flows and profitability. At January 2,
2010, and December 27, 2008, the total amount of grant funding subject to specific contractual remedies was $10
million and $11 million, respectively.