Cabela's 2009 Annual Report Download - page 115
Download and view the complete annual report
Please find page 115 of the 2009 Cabela's annual report below. You can navigate through the pages in the report by either clicking on the pages listed below, or by using the keyword search tool below to find specific information within the annual report.-
 1
1 -
2
-
3
-
4
-
5
-
6
-
7
-
8
-
9
-
10
-
11
-
12
-
13
-
14
-
15
-
16
-
17
-
18
-
19
-
20
-
21
-
22
-
23
-
24
-
25
-
26
-
27
-
28
-
29
-
30
-
31
-
32
-
33
-
34
-
35
-
36
-
37
-
38
-
39
-
40
-
41
-
42
-
43
-
44
-
45
-
46
-
47
-
48
-
49
-
50
-
51
-
52
-
53
-
54
-
55
-
56
-
57
-
58
-
59
-
60
-
61
-
62
-
63
-
64
-
65
-
66
-
67
-
68
-
69
-
70
-
71
-
72
-
73
-
74
-
75
-
76
-
77
-
78
-
79
-
80
-
81
-
82
-
83
-
84
-
85
-
86
-
87
-
88
-
89
-
90
-
91
-
92
-
93
-
94
-
95
-
96
-
97
-
98
-
99
-
100
-
101
-
102
-
103
-
104
-
 105
105 -
 106
106 -
 107
107 -
 108
108 -
 109
109 -
 110
110 -
 111
111 -
 112
112 -
 113
113 -
 114
114 -
 115
115 -
 116
116 -
 117
117 -
 118
118 -
 119
119 -
 120
120 -
 121
121 -
 122
122 -
 123
123 -
 124
124 -
 125
125 -
126
-
127
-
128
-
129
-
130
-
131
 |
 |

106
CABELA’S INCORPORATED AND SUBSIDIARIES
NOTES TO CONSOLIDATED FINANCIAL STATEMENTS
(Dollars in Thousands Except Share and Per Share Amounts)
current market rates; indicative pricing for such instruments; the rates from the last date WFB considered the market
for these instruments to be active and orderly, adjusted for changes in credit spreads in accordance with ASC Section
820-10-35, Fair Value Measurements and Disclosures: Overall: Subsequent Measurement and ASC Section 820-10-
65, Fair Value Measurements and Disclosures: Overall: Transition and Open Effective Date Information; and the
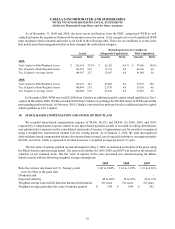
discount rates used to value other retained interests in securitized loans. At the end of December 2009, the weighted
average discount rate used to value the triple-A rated notes was 1.34%, the A rated notes was 5.16%, the triple-B rated
notes was 6.56%, and the double-B rated notes was 11.00%. Declines in the fair value of asset-backed available for
sale securities below amortized cost that are deemed to be other than temporary are reflected in current earnings.
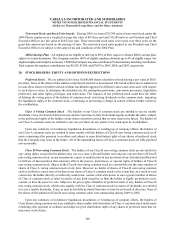
Fair values of economic development bonds (“bonds”) are estimated using discounted cash flow projection
estimates based on available market interest rates and the estimated amounts and timing of expected future payments
to be received from municipalities under tax development zones. These fair values do not reflect any premium or
discount that could result from offering these bonds for sale or through early redemption, or any related income tax
impact. Declines in the fair value of held-to-maturity and available-for-sale economic development bonds below cost
that are deemed to be other than temporary are reflected in earnings. During 2009, 2008, and 2007, we evaluated the
recovery of certain bonds and determined their fair value using significant unobservable inputs (Level 3) as defined
by and in accordance with the provisions of ASC Topic 820. The fair value of these bonds was determined to be below
carrying value, with the decline in fair value deemed to be other than temporary, resulting in fair value adjustments
totaling $8,032, $1,280, and $6,733 at the end of 2009, 2008, and 2007, respectively, reducing the carrying value of
the bond portfolio.
Certain assets are measured at fair value on a non-recurring basis using significant unobservable inputs
(Level 3) as defined by and in accordance with the provisions of ASC Topic 820. As such, property and equipment,
land held for sale, goodwill, and other intangibles with a net carrying amount totaling $136,572 were written down to
their fair value of $76,345 during 2009. These write-downs resulted in a total impairment charge of $60,227 reflected
in earnings for the year ended 2009.
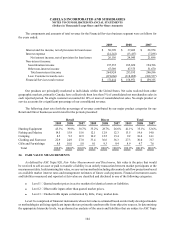
The estimated fair value of credit card loans receivable and the credit card loans held for sale is based on the
present value of future expected cash flows using assumptions for credit losses, payment rates, finance charge yield,
and discount rates commensurate with the risks involved. This valuation does not include the value that relates to
estimated cash flows generated from new loans over the life of the cardholder relationship. Accordingly, the aggregate
fair value of the credit card loans does not represent the underlying value of the established cardholder relationship.
Time deposits are pooled in homogeneous groups and the future cash flows of these groups are discounted using
current market rates offered for similar products for estimating fair value.
The following table provides the estimated fair values of financial instruments not carried at fair value at the
years ended:
2009 2008
Carrying
Value Estimated
Fair Value Carrying
Value Estimated
Fair Value
Financial Assets
Credit card loans, net $ 135,935 $140,199 $167,226 $168,429
Financial Liabilities
Time deposits 476,664 499,838 486,199 508,190
Long-term debt 348,279 343,108 380,031 373,304