Cabela's 2009 Annual Report Download - page 50
Download and view the complete annual report
Please find page 50 of the 2009 Cabela's annual report below. You can navigate through the pages in the report by either clicking on the pages listed below, or by using the keyword search tool below to find specific information within the annual report.-
 1
1 -
2
-
3
-
4
-
5
-
6
-
7
-
8
-
9
-
10
-
11
-
12
-
13
-
14
-
15
-
16
-
17
-
18
-
19
-
20
-
21
-
22
-
23
-
24
-
25
-
26
-
27
-
28
-
29
-
30
-
31
-
32
-
33
-
34
-
35
-
36
-
37
-
38
-
39
-
 40
40 -
 41
41 -
 42
42 -
 43
43 -
 44
44 -
 45
45 -
 46
46 -
 47
47 -
 48
48 -
 49
49 -
 50
50 -
 51
51 -
 52
52 -
 53
53 -
 54
54 -
 55
55 -
 56
56 -
 57
57 -
 58
58 -
 59
59 -
 60
60 -
61
-
62
-
63
-
64
-
65
-
66
-
67
-
68
-
69
-
70
-
71
-
72
-
73
-
74
-
75
-
76
-
77
-
78
-
79
-
80
-
81
-
82
-
83
-
84
-
85
-
86
-
87
-
88
-
89
-
90
-
91
-
92
-
93
-
94
-
95
-
96
-
97
-
98
-
99
-
100
-
101
-
102
-
103
-
104
-
105
-
106
-
107
-
108
-
109
-
110
-
111
-
112
-
113
-
114
-
115
-
116
-
117
-
118
-
119
-
120
-
121
-
122
-
123
-
124
-
125
-
126
-
127
-
128
-
129
-
130
-
131
 |
 |

41
2009 2008 Increase
(Decrease) % Change
Percentage increase year over year in Internet website visits 19.5%32.0%
Catalog circulation in pages (in millions) 25,927 32,085 (6,158)(19.2)%
Number of separate catalog titles circulated 97 100 (3)
Internet sales increased in 2009 compared to 2008. Internet site visits increased as we continued to focus our
efforts on utilizing Direct marketing programs to increase traffic to our website. Internet visits increased 19.5%
to 159.5 million visits during 2009 compared to 133.5 million visits during 2008. The hunting equipment product
category was the largest dollar volume contributor to our Direct revenue for 2009. The number of active Direct
customers, which we define as those customers who have purchased merchandise from us in the last twelve months,
increased by approximately 2% compared to 2008.
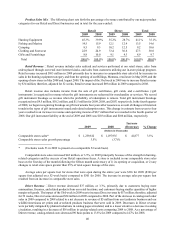
Financial Services Revenue – Key statistics reflecting the performance of our Financial Services business are
shown in the following chart for the years ended:
2009 2008 Increase
(Decrease) % Change
(Dollars in Thousands Except Average Balance per Account)
Average balance of managed credit card loans $ 2,311,820 $ 2,085,481 $ 226,339 10.9%
Average number of active credit card accounts 1,244,621 1,140,834 103,787 9.1
Average balance per active credit card account $ 1,857 $1,828 $29 1.6
Net charge-offs on managed loans $ 117,072 $61,448 $55,624 90.5
Net charge-offs as a percentage of average
managed credit card loans 5.06%2.95%2.11%
The average balance of managed credit card loans increased to $2.3 billion, or 10.9%, due to the increase in
the number of accounts and the average balance per account. The average number of accounts increased to over
1.2 million, or 9.1%, due to our marketing efforts. Net charge-offs as a percentage of average managed credit card
loans increased to 5.06% for 2009 principally because of the challenging macroeconomic environment. We believe
our charge-off levels remain below industry average. During 2009, WFB executed two change of terms to lessen
the effects of the provisions of the CARD Act and increasing credit card charge-offs. These changes impacted our
Financial Services revenue, which increased $12 million or 7.8% in 2009 compared to 2008.
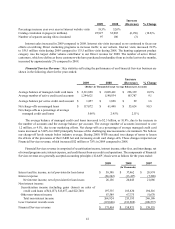
Financial Services revenue is comprised of securitization income, interest income, other fees, and interchange, net
of reward program costs, interest expense, and credit losses from our credit card operations. The components of Financial
Services revenue on a generally accepted accounting principles (“GAAP”) basis were as follows for the years ended:
2009 2008 2007
(In Thousands)
Interest and fee income, net of provision for loan losses $ 50,398 $37,462 $28,974
Interest expense (24,242)(13,417)(7,288)
Net interest income, net of provision for loan losses 26,156 24,045 21,686
Non-interest income:
Securitization income (including gains (losses) on sales of
credit card loans of $(4,157), $15,657, and $22,740) 197,335 185,820 194,516
Other non-interest income 67,589 67,375 51,670
Total non-interest income 264,924 253,195 246,186
Less: Customer rewards costs (119,666) (118,269) (108,537)
Financial Services revenue $ 171,414 $158,971 $159,335