Cabela's 2009 Annual Report Download - page 81
Download and view the complete annual report
Please find page 81 of the 2009 Cabela's annual report below. You can navigate through the pages in the report by either clicking on the pages listed below, or by using the keyword search tool below to find specific information within the annual report.-
 1
1 -
2
-
3
-
4
-
5
-
6
-
7
-
8
-
9
-
10
-
11
-
12
-
13
-
14
-
15
-
16
-
17
-
18
-
19
-
20
-
21
-
22
-
23
-
24
-
25
-
26
-
27
-
28
-
29
-
30
-
31
-
32
-
33
-
34
-
35
-
36
-
37
-
38
-
39
-
40
-
41
-
42
-
43
-
44
-
45
-
46
-
47
-
48
-
49
-
50
-
51
-
52
-
53
-
54
-
55
-
56
-
57
-
58
-
59
-
60
-
61
-
62
-
63
-
64
-
65
-
66
-
67
-
68
-
69
-
70
-
 71
71 -
 72
72 -
 73
73 -
 74
74 -
 75
75 -
 76
76 -
 77
77 -
 78
78 -
 79
79 -
 80
80 -
 81
81 -
 82
82 -
 83
83 -
 84
84 -
 85
85 -
 86
86 -
 87
87 -
 88
88 -
 89
89 -
 90
90 -
 91
91 -
92
-
93
-
94
-
95
-
96
-
97
-
98
-
99
-
100
-
101
-
102
-
103
-
104
-
105
-
106
-
107
-
108
-
109
-
110
-
111
-
112
-
113
-
114
-
115
-
116
-
117
-
118
-
119
-
120
-
121
-
122
-
123
-
124
-
125
-
126
-
127
-
128
-
129
-
130
-
131
 |
 |

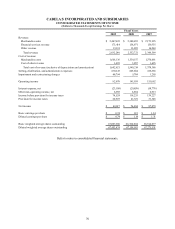
72
CABELA’S INCORPORATED AND SUBSIDIARIES
CONSOLIDATED STATEMENTS OF CASH FLOWS
(In Thousands)
Fiscal Years
2009 2008 2007
CASH FLOWS FROM OPERATING ACTIVITIES:
Net income $ 49,617 $76,404 $87,879
Adjustments to reconcile net income to net cash flows from operating activities:
Depreciation and amortization 70,566 64,673 59,863
Impairment and restructuring, net of cash 62,237 2,482 1,205
Stock based compensation 9,410 6,535 4,944
Deferred income taxes (9,927)6,928 (1,077)
Other, net 4,662 (5,732)(1,372)
Change in operating assets and liabilities, net of business acquisition:
Accounts receivable 11,599 2,633 (8,425)
Credit card loans held for sale, net (177,461)(271,730)(378,186)
Securitizations of credit card loans, net 207,312 292,687 336,000
Retained interests in securitized loans (including asset-backed securities) (39,724)(14,578)(11,244)
Inventories 71,773 90,502 (119,051)
Prepaid expenses and other current assets (17,009)(12,517)(10,964)
Land held for sale or development (339)1,474 (10,379)
Accounts payable and accrued expenses 33,418 (83,857)9,756
Gift certificates, and credit card and loyalty rewards programs (828)576 39,789
Other long-term liabilities 1,306 22,050 15,926
Income taxes payable 17,408 (23,562)17,164
Net cash provided by operating activities 294,020 154,968 31,828
CASH FLOWS FROM INVESTING ACTIVITIES:
Property and equipment additions (49,113)(91,164)(335,644)
Proceeds from dispositions of property and equipment 11,914 27 3,931
Purchases of economic development bonds - (18,525)(36,223)
Proceeds from retirements and maturities of economic development bonds 2,654 3,405 45,427
Purchases of asset-backed available-for-sale securities classified with retained interests in
securitized loans (76,924) - -
Change in credit card loans receivable, net 333 2,450 1,228
Acquisition, net of cash acquired - - (9,277)
Proceeds from sales or maturities of short-term investments - 2,946 -
Other investing changes, net 5,113 2,650 (935)
Net cash used in investing activities (106,023)(98,211)(331,493)
CASH FLOWS FROM FINANCING ACTIVITIES:
Change in unpresented checks net of bank balance 16,177 16,877 11,340
Change in time deposits, net (8,225)325,608 58,395
Changes in short-term borrowings of financial services subsidiary - (100,000)93,509
Borrowings on revolving credit facilities and inventory financing 626,091 778,135 510,939
Repayments on revolving credit facilities and inventory financing (651,992)(815,710)(454,757)
Issuances of long-term debt - 61,200 60,800
Payments on long-term debt (289)(52,874)(27,008)
Exercise of employee stock options and employee stock purchase plan issuances, net 4,346 7,719 3,978
Other financing changes, net (2,024)1,210 748
Net cash (used in) provided by financing activities (15,916)222,165 257,944
Net change in cash and cash equivalents 172,081 278,922 (41,721)
Cash and cash equivalents, at beginning of year 410,104 131,182 172,903
Cash and cash equivalents, at end of year $ 582,185 $410,104 $131,182
Refer to notes to consolidated financial statements.