Cabela's 2009 Annual Report Download - page 107
Download and view the complete annual report
Please find page 107 of the 2009 Cabela's annual report below. You can navigate through the pages in the report by either clicking on the pages listed below, or by using the keyword search tool below to find specific information within the annual report.-
 1
1 -
2
-
3
-
4
-
5
-
6
-
7
-
8
-
9
-
10
-
11
-
12
-
13
-
14
-
15
-
16
-
17
-
18
-
19
-
20
-
21
-
22
-
23
-
24
-
25
-
26
-
27
-
28
-
29
-
30
-
31
-
32
-
33
-
34
-
35
-
36
-
37
-
38
-
39
-
40
-
41
-
42
-
43
-
44
-
45
-
46
-
47
-
48
-
49
-
50
-
51
-
52
-
53
-
54
-
55
-
56
-
57
-
58
-
59
-
60
-
61
-
62
-
63
-
64
-
65
-
66
-
67
-
68
-
69
-
70
-
71
-
72
-
73
-
74
-
75
-
76
-
77
-
78
-
79
-
80
-
81
-
82
-
83
-
84
-
85
-
86
-
87
-
88
-
89
-
90
-
91
-
92
-
93
-
94
-
95
-
96
-
 97
97 -
 98
98 -
 99
99 -
 100
100 -
 101
101 -
 102
102 -
 103
103 -
 104
104 -
 105
105 -
 106
106 -
 107
107 -
 108
108 -
 109
109 -
 110
110 -
 111
111 -
 112
112 -
 113
113 -
 114
114 -
 115
115 -
 116
116 -
 117
117 -
118
-
119
-
120
-
121
-
122
-
123
-
124
-
125
-
126
-
127
-
128
-
129
-
130
-
131
 |
 |

98
CABELA’S INCORPORATED AND SUBSIDIARIES
NOTES TO CONSOLIDATED FINANCIAL STATEMENTS
(Dollars in Thousands Except Share and Per Share Amounts)
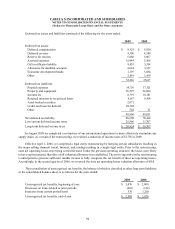
The following table summarizes option activity during 2009 for our 1997 Stock Option Plan (the “1997 Plan”)
and our Cabela’s Incorporated 2004 Stock Plan (the “2004 Plan”):
All Options Non-Vested Options
Options
Available
for Grant Number
of Options
Weighted
Average
Exercise
Price Number
of Options
Weighted
Average
Grant Date
Fair Value
Outstanding, beginning of year 1,541,668 5,283,250 $17.08 2,659,327 $5.15
Additional shares authorized 3,750,000
Granted (1,579,160)1,579,160 7.82 1,579,160 7.82
Vested -(1,270,557)7.32
Exercised -(235,884)8.88 -
Forfeited (1)(2) 380,831 (423,954)14.96 (174,705)5.83
Outstanding, end of year (3) 4,093,339 6,202,572 14.21 2,793,225 5.63
(1) Options forfeited under the 1997 Plan do not become available for grant under the 2004 Plan.
(2) Options forfeited under the 2004 Plan are immediately available for grant.
(3) Options outstanding at the end of 2009 were comprised of 545,896 of incentive stock options and 5,656,676 of
nonqualified stock options.
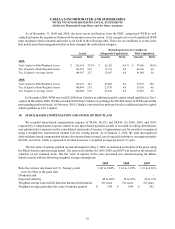
The following table provides information relating to our equity share-based payment awards at January 2, 2010:
Shares
Weighted
Average
Exercise
Price
Weighted
Average
Fair
Value
Aggregate
Intrinsic
Value
Weighted
Average
Remaining
Contractual
Life (in Years)
Vested and exercisable 3,409,347 $17.40 $7.65 $3,150 4.69
Non-vested 2,793,225 10.33 5.63 15,730 6.70
Total outstanding 6,202,572 14.21 7.10 $18,880 5.64
Expected to vest after January 2, 2010 2,736,130 10.335.63 $15,372 6.70
The aggregate intrinsic value of awards exercised was $1,168, $2,602, and $8,188, during 2009, 2008, and
2007, respectively. The total fair value of shares vested was $9,300, $12,864, and $5,025, in 2009, 2008, and 2007,
respectively. Based on our closing stock price of $14.26 as of January 2, 2010, the total number of in-the-money
awards exercisable as of January 2, 2010, was 920,424.