Cabela's 2009 Annual Report Download - page 7
Download and view the complete annual report
Please find page 7 of the 2009 Cabela's annual report below. You can navigate through the pages in the report by either clicking on the pages listed below, or by using the keyword search tool below to find specific information within the annual report.-
 1
1 -
 2
2 -
 3
3 -
 4
4 -
 5
5 -
 6
6 -
 7
7 -
 8
8 -
 9
9 -
 10
10 -
 11
11 -
 12
12 -
 13
13 -
 14
14 -
 15
15 -
 16
16 -
 17
17 -
 18
18 -
19
-
20
-
21
-
22
-
23
-
24
-
25
-
26
-
27
-
28
-
29
-
30
-
31
-
32
-
33
-
34
-
35
-
36
-
37
-
38
-
39
-
40
-
41
-
42
-
43
-
44
-
45
-
46
-
47
-
48
-
49
-
50
-
51
-
52
-
53
-
54
-
55
-
56
-
57
-
58
-
59
-
60
-
61
-
62
-
63
-
64
-
65
-
66
-
67
-
68
-
69
-
70
-
71
-
72
-
73
-
74
-
75
-
76
-
77
-
78
-
79
-
80
-
81
-
82
-
83
-
84
-
85
-
86
-
87
-
88
-
89
-
90
-
91
-
92
-
93
-
94
-
95
-
96
-
97
-
98
-
99
-
100
-
101
-
102
-
103
-
104
-
105
-
106
-
107
-
108
-
109
-
110
-
111
-
112
-
113
-
114
-
115
-
116
-
117
-
118
-
119
-
120
-
121
-
122
-
123
-
124
-
125
-
126
-
127
-
128
-
129
-
130
-
131
 |
 |

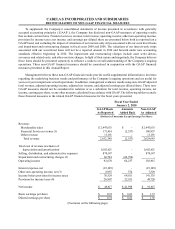
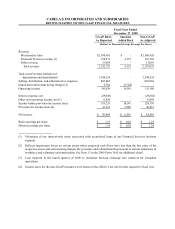
To supplement the Company’s consolidated statements of income presented in accordance with generally
accepted accounting principles (“GAAP”), the Company has disclosed non-GAAP measures of operating results
that exclude certain items. Financial services revenue; total revenue; operating income; other non-operating income;
provision for income taxes; net income; and earnings per diluted share are presented below both as reported (on a
GAAP basis) and excluding the impact of valuations of our interest-only strips associated with our securitized loans
and impairment and restructuring charges in fiscal years 2009 and 2008. The valuations of our interest-only strips
associated with our securitized loans will not be a reported amount in 2010 and forward under new accounting
standards effective beginning in 2010. The impairment and restructuring charges include asset write-downs,
severance and related costs, and other one time charges. In light of their nature and magnitude, the Company believes
these items should be presented separately to enhance a reader’s overall understanding of the Company’s ongoing
operations. These non-GAAP financial measures should be considered in conjunction with the GAAP financial
measures presented in this Annual Report.
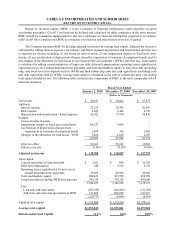
Management believes these non-GAAP financial results provide useful supplemental information to investors
regarding the underlying business trends and performance of the Company’s ongoing operations and are useful for
year-over-year comparisons of such operations. In addition, management evaluates results using non-GAAP adjusted
total revenue, adjusted operating income, adjusted net income, and adjusted earnings per diluted share. These non-
GAAP measures should not be considered in isolation or as a substitute for total revenue, operating income, net
income, earnings per share, or any other measure calculated in accordance with GAAP. The following tables reconcile
these financial measures to the related GAAP financial measures for the fiscal years presented.
Fiscal Year Ended
January 2, 2010
GAAP Basis
As Reported Amounts
Added Back Non-GAAP
As Adjusted
(Dollars in Thousands Except Earnings Per Share)
Revenue:
Merchandise sales $2,447,635 $ - $2,447,635
Financial Services revenue (1) 171,414 (2,557) 168,857
Other revenue 13,191 - 13,191
Total revenue 2,632,240 (2,557) 2,629,683
Total cost of revenue (exclusive of
depreciation and amortization) 1,602,621 - 1,602,621
Selling, distribution, and administrative expenses 870,147 - 870,147
Impairment and restructuring charges (2) 66,794 (66,794) -
Operating income 92,678 64,237 156,915
Interest expense, net (23,109) - (23,109)
Other non-operating income, net (3) 6,955 574 7,529
Income before provision for income taxes 76,524 64,811 141,335
Provision for income taxes (4) 26,907 22,813 49,720
Net income $49,617 $41,998 $91,615
Basic earnings per share $0.74 $0.63 $1.37
Diluted earnings per share $0.74 $0.62 $1.36
(Footnotes on the following page)
CABELA’S INCORPORATED AND SUBSIDIARIES
RECONCILIATION OF NON-GAAP FINANCIAL MEASURES