Cabela's 2009 Annual Report Download - page 55
Download and view the complete annual report
Please find page 55 of the 2009 Cabela's annual report below. You can navigate through the pages in the report by either clicking on the pages listed below, or by using the keyword search tool below to find specific information within the annual report.-
 1
1 -
2
-
3
-
4
-
5
-
6
-
7
-
8
-
9
-
10
-
11
-
12
-
13
-
14
-
15
-
16
-
17
-
18
-
19
-
20
-
21
-
22
-
23
-
24
-
25
-
26
-
27
-
28
-
29
-
30
-
31
-
32
-
33
-
34
-
35
-
36
-
37
-
38
-
39
-
40
-
41
-
42
-
43
-
44
-
 45
45 -
 46
46 -
 47
47 -
 48
48 -
 49
49 -
 50
50 -
 51
51 -
 52
52 -
 53
53 -
 54
54 -
 55
55 -
 56
56 -
 57
57 -
 58
58 -
 59
59 -
 60
60 -
 61
61 -
 62
62 -
 63
63 -
 64
64 -
 65
65 -
66
-
67
-
68
-
69
-
70
-
71
-
72
-
73
-
74
-
75
-
76
-
77
-
78
-
79
-
80
-
81
-
82
-
83
-
84
-
85
-
86
-
87
-
88
-
89
-
90
-
91
-
92
-
93
-
94
-
95
-
96
-
97
-
98
-
99
-
100
-
101
-
102
-
103
-
104
-
105
-
106
-
107
-
108
-
109
-
110
-
111
-
112
-
113
-
114
-
115
-
116
-
117
-
118
-
119
-
120
-
121
-
122
-
123
-
124
-
125
-
126
-
127
-
128
-
129
-
130
-
131
 |
 |

46
In connection with the preparation of our consolidated financial statements for 2009 and 2008, we evaluated
the recoverability of our property, equipment, land held for sale, economic development bonds, goodwill and other
intangible assets. This evaluation included our existing store locations and future retail store sites. In accordance
with the provisions of ASC Topic 360, Property, Plant, and Equipment, ASC Topic 320, Investments—Debt and
Equity Securities, and ASC Topic 350 Intangibles—Goodwill and Other, we recognized impairment losses totaling
$62 million and $4 million in 2009 and 2008, respectively. Economic trends could change undiscounted cash flows
in future periods which could trigger possible future write downs.
In 2009, we incurred charges totaling $5 million for severance and related benefits primarily from outplacement
costs and a voluntary retirement plan implemented in February 2009. In October 2008, we announced a reduction in
workforce of approximately 10% at our company headquarters which resulted in $2 million recorded in severance
and related benefits under this workforce reduction plan. All impairment and restructuring charges were recorded to
the Corporate Overhead and Other segment for 2009 and 2008.
Our long-lived assets are evaluated for possible impairment whenever changes in circumstances may indicate
that the carrying value of an asset may not be recoverable. Important factors we consider that could result in an
impairment review are underperformance of the asset compared to historical or planned operations, significant
changes in the utilization of the asset, or changes related to our strategic plans. An impairment loss is recognized
when the estimated undiscounted cash flows expected to result from the use of the asset plus any expected proceeds
from the disposition of the asset, if any, are less than its carrying value. When an impairment loss is recognized, the
carrying amount of the asset is recorded to its estimated fair value based on independent outside market prices or
other valuation techniques.
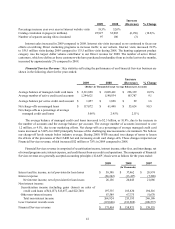
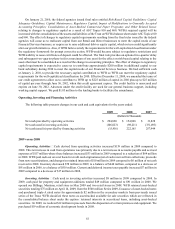
Operating Income
Operating income is revenue less cost of revenue and selling, distribution, and administrative expenses.
Operating income for our merchandise business segments excludes costs associated with operating expenses of
distribution centers, procurement activities, and other corporate overhead costs.
2009 2008 Increase
(Decrease) % Change
(Dollars in Thousands)
Total operating income $ 92,678 $ 141,039 $ (48,361) (34.3)%
Total operating income as a percentage
of total revenue 3.5% 5.5%
Operating income by business segment:
Retail $ 163,018 $ 141,578 $ 21,440 15.1
Direct 161,052 161,249 (197) (0.1)
Financial Services 49,598 46,184 3,414 7.4
Operating income as a percentage
of segment revenue:
Retail 11.7% 11.0%
Direct 15.2 14.7
Financial Services 28.9 29.1
Including the effect of impairment and restructuring charges recorded in 2009 and 2008 totaling $67 million
and $6 million, respectively, operating income decreased $48 million, or 34.3%, in 2009 compared to 2008. Operating
income as a percentage of revenue also decreased to 3.5% for 2009 from 5.5% for 2008. Operating income comparisons
between 2009 and 2008 are also impacted by the challenging retail and macroeconomic environment. The decreases
in operating income and operating income as a percentage of revenue were due to additional asset impairment charges
and retirement and severance benefits recorded in 2009, lower revenue from our Direct business segment, and lower