Cabela's 2009 Annual Report Download - page 48
Download and view the complete annual report
Please find page 48 of the 2009 Cabela's annual report below. You can navigate through the pages in the report by either clicking on the pages listed below, or by using the keyword search tool below to find specific information within the annual report.-
 1
1 -
2
-
3
-
4
-
5
-
6
-
7
-
8
-
9
-
10
-
11
-
12
-
13
-
14
-
15
-
16
-
17
-
18
-
19
-
20
-
21
-
22
-
23
-
24
-
25
-
26
-
27
-
28
-
29
-
30
-
31
-
32
-
33
-
34
-
35
-
36
-
37
-
 38
38 -
 39
39 -
 40
40 -
 41
41 -
 42
42 -
 43
43 -
 44
44 -
 45
45 -
 46
46 -
 47
47 -
 48
48 -
 49
49 -
 50
50 -
 51
51 -
 52
52 -
 53
53 -
 54
54 -
 55
55 -
 56
56 -
 57
57 -
 58
58 -
59
-
60
-
61
-
62
-
63
-
64
-
65
-
66
-
67
-
68
-
69
-
70
-
71
-
72
-
73
-
74
-
75
-
76
-
77
-
78
-
79
-
80
-
81
-
82
-
83
-
84
-
85
-
86
-
87
-
88
-
89
-
90
-
91
-
92
-
93
-
94
-
95
-
96
-
97
-
98
-
99
-
100
-
101
-
102
-
103
-
104
-
105
-
106
-
107
-
108
-
109
-
110
-
111
-
112
-
113
-
114
-
115
-
116
-
117
-
118
-
119
-
120
-
121
-
122
-
123
-
124
-
125
-
126
-
127
-
128
-
129
-
130
-
131
 |
 |

39
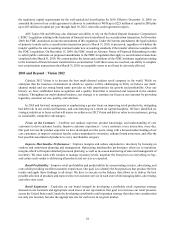
Direct Channel Growth – Grow our Direct business by capitalizing on quick-to-market Internet and electronic
marketing opportunities and expanding international business. Our goal is to continue to fine tune our catalogs, as
well as the number of pages and product mix in each, in order to improve the profitability of each title. We want
to create steady, profitable growth in our Direct channels, while reducing marketing expenses and significantly
increasing the percentage of market share we capture through the Internet.
Financial Service Performance – Continue to attract new cardholders through our Retail and Direct
businesses and increase the amount of merchandise or services customers purchase with their CLUB Visa cards
while maintaining bank profitability and preserving customer loyalty. Our goal is to create marketing plans, promote
additional products, and expand our partnership programs to best serve our customers’ needs and give us brand
exposure. We believe our Financial Services business will continue to keep credit card delinquencies and charge-offs
below industry average by adhering to our conservative underwriting criteria and active account management.
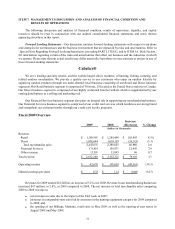
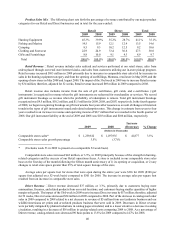
Operations Review
Our operating results expressed as a percentage of revenue were as follows for the years ended:
2009 2008 2007
Revenue 100.00%100.00%100.00%
Cost of revenue 60.88 60.34 58.66
Gross profit (exclusive of depreciation and amortization) 39.12 39.66 41.34
Selling, distribution, and administrative expenses 33.06 33.91 34.85
Impairment and restructuring charges 2.54 0.23 0.05
Operating income 3.52 5.52 6.44
Other income (expense):
Interest expense, net (0.88)(1.16)(0.80)
Other income, net 0.26 0.27 0.29
Total other income (expense), net (0.62)(0.89)(0.51)
Income before provision for income taxes 2.90 4.63 5.93
Provision for income taxes 1.02 1.64 2.19
Net income 1.88%2.99%3.74%
Results of Operations - 2009 Compared to 2008
Revenues
2009 %2008 %Increase
(Decrease) % Change
(Dollars in Thousands)
Retail $1,388,991 52.8% $ 1,285,496 50.4% $ 103,495 8.1%
Direct 1,058,644 40.2 1,095,159 42.9 (36,515)(3.3)
Financial Services 171,414 6.5 158,971 6.2 12,443 7.8
Other 13,191 0.5 13,095 0.5 96 0.7
$ 2,632,240 100.0% $ 2,552,721 100.0% $ 79,519 3.1%