Cabela's 2009 Annual Report Download - page 58
Download and view the complete annual report
Please find page 58 of the 2009 Cabela's annual report below. You can navigate through the pages in the report by either clicking on the pages listed below, or by using the keyword search tool below to find specific information within the annual report.-
 1
1 -
2
-
3
-
4
-
5
-
6
-
7
-
8
-
9
-
10
-
11
-
12
-
13
-
14
-
15
-
16
-
17
-
18
-
19
-
20
-
21
-
22
-
23
-
24
-
25
-
26
-
27
-
28
-
29
-
30
-
31
-
32
-
33
-
34
-
35
-
36
-
37
-
38
-
39
-
40
-
41
-
42
-
43
-
44
-
45
-
46
-
47
-
 48
48 -
 49
49 -
 50
50 -
 51
51 -
 52
52 -
 53
53 -
 54
54 -
 55
55 -
 56
56 -
 57
57 -
 58
58 -
 59
59 -
 60
60 -
 61
61 -
 62
62 -
 63
63 -
 64
64 -
 65
65 -
 66
66 -
 67
67 -
 68
68 -
69
-
70
-
71
-
72
-
73
-
74
-
75
-
76
-
77
-
78
-
79
-
80
-
81
-
82
-
83
-
84
-
85
-
86
-
87
-
88
-
89
-
90
-
91
-
92
-
93
-
94
-
95
-
96
-
97
-
98
-
99
-
100
-
101
-
102
-
103
-
104
-
105
-
106
-
107
-
108
-
109
-
110
-
111
-
112
-
113
-
114
-
115
-
116
-
117
-
118
-
119
-
120
-
121
-
122
-
123
-
124
-
125
-
126
-
127
-
128
-
129
-
130
-
131
 |
 |
49
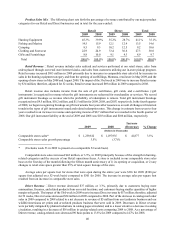
Financial Services Revenue. Financial Services revenue decreased 0.2% in 2008 compared to 2007 principally
from decreases in securitization income, higher spreads and fees paid to investors on new securitizations, higher net
charge-offs, and related decreases in the valuation of our interest-only strips associated with our securitized loans;
mostly offset by growth in the number of active credit card accounts, the associated loans, and interchange income.
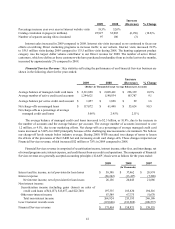
We also measure the results of our Financial Services business on a non-GAAP managed basis as explained
earlier. Interest income on a non-GAAP managed basis increased $17 million in 2008 from 2007 due to an increase in
managed credit card loans and changes to interest charged, partially offset by decreases in interest rates. Interchange
income increased $14 million driven by net credit card purchases, which increased 14.5% over 2007. Other fee income
increased $11 million due to growth in the number of credit card loans, changes to fees charged, and increases in
late fees, overlimit fees, and payment assurance fees. The increases in interest income and interchange income were
partially offset by an increase in interest expense of $7 million from increases in securitized credit card loans and
borrowings, higher spreads and fees paid to investors on new securitizations, and increases in certificates of deposits.
Partially offsetting the increases in interest income and interchange income was an increase in the provision for loan
losses of $29 million from increases in managed credit card loans and a decrease of $6 million in the Other category.
Compared to 2007, the number of average active accounts in 2008 grew by 15.5% to over 1.1 million, and the average
balance per active account increased 6.8% to $1,828.
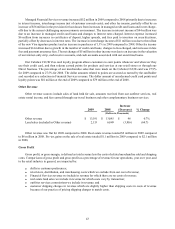
Gross Profit
Gross profit increased by $41 million, or 4.3%, to $1.0 billion in 2008 compared to 2007. Gross margins of our
merchandising business increased $44 million, or 5.5%, to $841 million in 2008. Merchandise gross margins as a
percentage of revenue of our merchandising business decreased to 35.3% in 2008 from 36.7% in 2007. The decrease
in merchandise gross margins as a percentage of revenue for 2008 compared to 2007 is primarily attributable to an
increase in sales discounts and allowances, an increase in hard goods sales with lower margins for 2008 compared to
2007, a shift in sales between channels, and a decrease in our shipping margin. Also in 2008, we experienced margin
pressure in certain hard goods categories due to increases in commodity prices. The merchandise gross margin for
2008 also includes $8.7 million of gift instrument breakage. Excluding this $8.7 million of gift instrument breakage
our merchandise gross margin for 2008 was 35.0%.
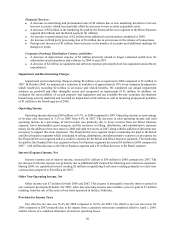
Selling, Distribution, and Administrative Expenses
Selling, distribution, and administrative expenses on a consolidated basis increased $47 million, or 5.7%, for
2008 over 2007. The primary reason for the increase was the addition of two new stores in 2008 and eight new stores
in 2007 (six added in the fourth quarter of 2007), along with the addition of infrastructure necessary to support this
store expansion. The most significant factors contributing to the increase in selling, distribution, and administrative
expenses, and the infrastructure expansion required to support the revenue growth in 2008 from our retail store
expansion, included:
Retail Business Segment:
• Operating costs for new stores that were not open in 2007 of $60 million, including employee compensation
and benefit costs of $38 million and $10 million in advertising and promotional expenses.
• An increase in existing retail store operating costs of $14 million over 2007.
• A decrease in comparable store employee compensation and benefits of $9 million resulting from staffing
changes and declining sales in comparable stores.
• An increase in depreciation on stores of $8 million over 2007.
• New store pre-opening costs of $8 million, a decrease of $9 million compared to 2007.
• Lower marketing fees of $1 million received from the Financial Services segment.
Direct Business Segment:
• A decrease in catalog costs and certain information system costs of $9 million compared to 2007 specifically
related to our website.
• Lower marketing fees of $4 million received from the Financial Services segment.