Cabela's 2009 Annual Report Download - page 49
Download and view the complete annual report
Please find page 49 of the 2009 Cabela's annual report below. You can navigate through the pages in the report by either clicking on the pages listed below, or by using the keyword search tool below to find specific information within the annual report.-
 1
1 -
2
-
3
-
4
-
5
-
6
-
7
-
8
-
9
-
10
-
11
-
12
-
13
-
14
-
15
-
16
-
17
-
18
-
19
-
20
-
21
-
22
-
23
-
24
-
25
-
26
-
27
-
28
-
29
-
30
-
31
-
32
-
33
-
34
-
35
-
36
-
37
-
38
-
 39
39 -
 40
40 -
 41
41 -
 42
42 -
 43
43 -
 44
44 -
 45
45 -
 46
46 -
 47
47 -
 48
48 -
 49
49 -
 50
50 -
 51
51 -
 52
52 -
 53
53 -
 54
54 -
 55
55 -
 56
56 -
 57
57 -
 58
58 -
 59
59 -
60
-
61
-
62
-
63
-
64
-
65
-
66
-
67
-
68
-
69
-
70
-
71
-
72
-
73
-
74
-
75
-
76
-
77
-
78
-
79
-
80
-
81
-
82
-
83
-
84
-
85
-
86
-
87
-
88
-
89
-
90
-
91
-
92
-
93
-
94
-
95
-
96
-
97
-
98
-
99
-
100
-
101
-
102
-
103
-
104
-
105
-
106
-
107
-
108
-
109
-
110
-
111
-
112
-
113
-
114
-
115
-
116
-
117
-
118
-
119
-
120
-
121
-
122
-
123
-
124
-
125
-
126
-
127
-
128
-
129
-
130
-
131
 |
 |

40
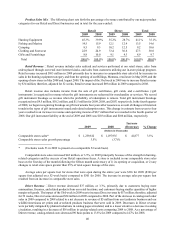
Product Sales Mix – The following chart sets forth the percentage of revenue contributed by our major product
categories for our Retail and Direct businesses and in total for the years ended:
Retail Direct Total
2009 2008 2009 2008 2009 2008
Hunting Equipment 45.3%39.9%35.2%28.7%41.1%35.1%
Fishing and Marine 14.5 15.9 12.1 12.9 13.5 14.6
Camping 8.5 9.3 10.2 12.5 9.2 10.6
Clothing and Footwear 22.9 24.9 33.4 36.6 27.3 30.0
Gifts and Furnishings 8.8 10.0 9.19.3 8.9 9.7
Total 100.0%100.0%100.0%100.0%100.0%100.0%
Retail Revenue – Retail revenue includes sales realized and services performed at our retail stores, sales from
orders placed through our retail store Internet kiosks, and sales from customers utilizing our in-store pick-up program.
Retail revenue increased $103 million in 2009 primarily due to increases in comparable store sales led by increases in
sales in the hunting equipment category and from the opening of our Billings, Montana, retail store in May 2009, and the
opening of new stores in May 2008 and August 2008. The impact of the 53rd week in 2009 was to increase Retail revenue
by $34 million; therefore, adjusted for 52 weeks, Retail revenue increased $69 million in 2009 compared to 2008.
Retail revenue also includes income from the sale of gift certificates, gift cards, and e-certificates (“gift
instruments”) recognized in revenue when the gift instruments are redeemed for merchandise or services. We record
gift instrument breakage as revenue when the probability of redemption is remote. Total gift instrument breakage
recognized was $4.5 million, $10.2 million, and $1.5 million for 2009, 2008, and 2007, respectively. In the fourth quarter
of 2008, we began recognizing breakage on gift instruments four years after issuance as a result of changes in historical
trends in the types of gift instruments issued and related redemption rates. This change in estimate from seven to four
years resulted in an increase in revenue and operating income of $8.7 million that we recorded in the fourth quarter of
2008. Our gift instrument liability at the end of 2009 and 2008 was $103 million and $106 million, respectively.
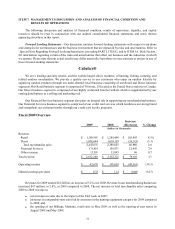
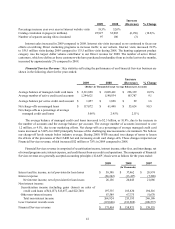
2009 2008 Increase
(Decrease) % Change
(Dollars in Thousands)
Comparable stores sales* $ 1,239,812 $ 1,197,935 $ 41,877 3.5%
Comparable stores sales growth percentage 3.5%(3.7)%
* (Excludes week 53 in 2009 to present on a comparable 52-week basis)
Comparable store sales increased $42 million, or 3.5%, in 2009 principally because of the strength in hunting-
related categories and the success of our Retail operations focus. A store is included in our comparable store sales
base on the first day of the month following the fifteen month anniversary of 1) its opening or acquisition, or 2) any
changes to retail store space greater than 25% of total square footage of the store.
Average sales per square foot for stores that were open during the entire year were $316 for 2009 ($308 per
square foot adjusted on a 52-week basis) compared to $301 for 2008. The increase in average sales per square foot
resulted from an increase in comparable store sales.
Direct Revenue – Direct revenue decreased $37 million, or 3.3%, primarily due to customers buying more
ammunition, firearms, and related products from our retail locations, and customers buying smaller quantities of higher
margin soft goods. The impact of the 53rd week in 2009 was to increase Direct revenue by $17 million; therefore, adjusted
for 52 weeks, Direct revenue decreased $54 million in 2009 compared to 2008. Part of the decrease in catalog mail order
sales in 2009 compared to 2008 related to a net decrease in revenue of $5 million from our taxidermy business and our
wildlife/Americana art prints and art-related products business that were sold in 2009. Decreases in Direct revenue
were partially mitigated by planned reductions in catalog pages circulated, and to a lesser extent to a decrease in catalog
circulation, resulting in a decrease of $16 million in catalog-related costs comparing 2009 to 2008. As a percentage of
Direct revenue, catalog-related costs decreased 90 basis points to 13.8% for 2009 compared to 14.7% for 2008.