Cabela's 2009 Annual Report Download - page 57
Download and view the complete annual report
Please find page 57 of the 2009 Cabela's annual report below. You can navigate through the pages in the report by either clicking on the pages listed below, or by using the keyword search tool below to find specific information within the annual report.-
 1
1 -
2
-
3
-
4
-
5
-
6
-
7
-
8
-
9
-
10
-
11
-
12
-
13
-
14
-
15
-
16
-
17
-
18
-
19
-
20
-
21
-
22
-
23
-
24
-
25
-
26
-
27
-
28
-
29
-
30
-
31
-
32
-
33
-
34
-
35
-
36
-
37
-
38
-
39
-
40
-
41
-
42
-
43
-
44
-
45
-
46
-
 47
47 -
 48
48 -
 49
49 -
 50
50 -
 51
51 -
 52
52 -
 53
53 -
 54
54 -
 55
55 -
 56
56 -
 57
57 -
 58
58 -
 59
59 -
 60
60 -
 61
61 -
 62
62 -
 63
63 -
 64
64 -
 65
65 -
 66
66 -
 67
67 -
68
-
69
-
70
-
71
-
72
-
73
-
74
-
75
-
76
-
77
-
78
-
79
-
80
-
81
-
82
-
83
-
84
-
85
-
86
-
87
-
88
-
89
-
90
-
91
-
92
-
93
-
94
-
95
-
96
-
97
-
98
-
99
-
100
-
101
-
102
-
103
-
104
-
105
-
106
-
107
-
108
-
109
-
110
-
111
-
112
-
113
-
114
-
115
-
116
-
117
-
118
-
119
-
120
-
121
-
122
-
123
-
124
-
125
-
126
-
127
-
128
-
129
-
130
-
131
 |
 |

48
Results of Operations – 2008 Compared to 2007
Financial Highlights 2008 2007 Increase
(Decrease) % Change
(Dollars in Thousands, Except Per Share Amounts)
Net income $ 76,404 $87,879 $(11,475)(13.1)%
Net income as a percentage of revenue 3.0%3.7%
Net income per diluted share $ 1.14 $1.31 $(0.17)(13.0)
Revenue by segment:
Direct $1,095,159 $1,130,553 $(35,394)(3.1)
Retail 1,285,496 1,043,442 242,054 23.2
Financial Services 158,971 159,335 (364)(0.2)
Other 13,095 16,269 (3,174)(19.5)
Total revenue $ 2,552,721 $2,349,599 $203,122 8.6
New store sales $ 389,378 $303,181 $86,197 28.4
Comparable store sales 884,970 919,258 (34,288)(3.7)
Average sales per square foot 301 332 (31)(9.3)
Gross Profit $ 1,012,507 $971,213 $41,294 4.3
Gross Profit as a percentage of revenue 39.7%41.3%
Merchandising gross margin $ 841,498 $797,304 $44,194 5.5
Merchandising gross margin as a percentage
of merchandising revenue 35.3%36.7%
Selling, distribution, and administrative
expenses $865,684 $818,916 $46,768 5.7
Selling, distribution and administrative
expenses as a percentage of revenue 33.9%34.9%
Operating income $ 141,039 $151,092 $(10,053)(6.7)
Operating income margin 5.5%6.4%
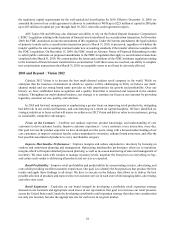
Revenues
Revenue increased $203 million, or 8.6%, in 2008 from growth in our Retail business segment partially offset
by decreases in catalog mail order sales in our Direct business segment. Other revenue decreased in 2008 from a
decrease in land sales.
Retail Revenue. Retail revenue increased $242 million, or 23.2%, primarily from the opening of two new stores
in 2008 and eight new stores in 2007 of which six were opened in the fourth quarter of 2007. The product category that
contributed the largest dollar volume increase to our Retail revenue for 2008 over 2007 was hunting equipment.
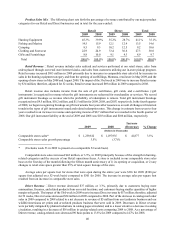
Direct Revenue. Direct revenue decreased $35 million, or 3.1%, primarily due to lower catalog sales and
to some cannibalization relating to our new retail stores, partially offset by increased Internet sales. Internet site
visits increased as we continued to focus our efforts on utilizing Direct marketing programs to increase traffic to
our website. Circulation of our catalogs decreased by 4.4 billion pages, or 12.1%, to 32.1 billion pages in 2008. The
net decrease in Direct revenue for 2008 compared to 2007 was due to decreases in the fishing and marine and the
clothing and footwear general product categories, partially offset by increases in camping, hunting equipment, and
gifts and furnishings.