Cabela's 2009 Annual Report Download - page 112
Download and view the complete annual report
Please find page 112 of the 2009 Cabela's annual report below. You can navigate through the pages in the report by either clicking on the pages listed below, or by using the keyword search tool below to find specific information within the annual report.-
 1
1 -
2
-
3
-
4
-
5
-
6
-
7
-
8
-
9
-
10
-
11
-
12
-
13
-
14
-
15
-
16
-
17
-
18
-
19
-
20
-
21
-
22
-
23
-
24
-
25
-
26
-
27
-
28
-
29
-
30
-
31
-
32
-
33
-
34
-
35
-
36
-
37
-
38
-
39
-
40
-
41
-
42
-
43
-
44
-
45
-
46
-
47
-
48
-
49
-
50
-
51
-
52
-
53
-
54
-
55
-
56
-
57
-
58
-
59
-
60
-
61
-
62
-
63
-
64
-
65
-
66
-
67
-
68
-
69
-
70
-
71
-
72
-
73
-
74
-
75
-
76
-
77
-
78
-
79
-
80
-
81
-
82
-
83
-
84
-
85
-
86
-
87
-
88
-
89
-
90
-
91
-
92
-
93
-
94
-
95
-
96
-
97
-
98
-
99
-
100
-
101
-
 102
102 -
 103
103 -
 104
104 -
 105
105 -
 106
106 -
 107
107 -
 108
108 -
 109
109 -
 110
110 -
 111
111 -
 112
112 -
 113
113 -
 114
114 -
 115
115 -
 116
116 -
 117
117 -
 118
118 -
 119
119 -
 120
120 -
 121
121 -
 122
122 -
123
-
124
-
125
-
126
-
127
-
128
-
129
-
130
-
131
 |
 |

103
CABELA’S INCORPORATED AND SUBSIDIARIES
NOTES TO CONSOLIDATED FINANCIAL STATEMENTS
(Dollars in Thousands Except Share and Per Share Amounts)
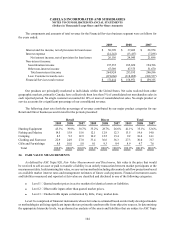
Financial information by segment is presented in the following tables for 2009, 2008 and 2007:
Fiscal Year 2009 Retail Direct Financial
Services
Corporate
Overhead
and Other Total
Revenue from external customers $ 1,388,991 $1,054,626 $171,880 $16,743 $2,632,240
Revenue (loss) from internal customers - 4,018 (466)(3,552) -
Total revenue $ 1,388,991 $1,058,644 $171,414 $13,191 $2,632,240
Operating income (loss) $ 163,018 $161,052 $49,598 $(280,990) $ 92,678
As a percentage of revenue 11.7%15.2%28.9%N/A 3.5%
Depreciation and amortization $ 41,822 $5,053 $1,186 $22,505 $70,566
Assets 878,045 757,366 810,571 45,903 2,491,885
Property and equipment additions
including accrued amounts 21,180 11,678 441 16,518 49,817
Fiscal Year 2008 Retail Direct Financial
Services
Corporate
Overhead
and Other Total
Revenue from external customers $ 1,283,148 $1,093,307 $159,423 $16,843 $2,552,721
Revenue (loss) from internal customers 2,348 1,852 (452)(3,748) -
Total revenue $ 1,285,496 $1,095,159 $158,971 $13,095 $2,552,721
Operating income (loss) $ 141,578 $161,249 $46,184 $(207,972) $ 141,039
As a percentage of revenue 11.0%14.7%29.1%N/A 5.5%
Depreciation and amortization $ 37,930 $4,198 $1,075 $21,470 $64,673
Assets 988,474 663,994 728,271 15,327 2,396,066
Property and equipment additions
including accrued amounts 21,033 6,501 1,592 25,808 54,934
Fiscal Year 2007 Retail Direct Financial
Services
Corporate
Overhead
and Other Total
Revenue from external customers $ 1,040,664 $1,127,942 $159,943 $21,050 $2,349,599
Revenue (loss) from internal customers 2,778 2,611 (608)(4,781) -
Total revenue $ 1,043,442 $1,130,553 $159,335 $16,269 $2,349,599
Operating income (loss) $ 127,744 $190,046 $37,448 $(204,146) $ 151,092
As a percentage of revenue 12.2%16.8%23.5%N/A 6.4%
Depreciation and amortization $ 29,830 $4,462 $1,129 $24,442 $59,863
Assets 1,065,234 480,341 450,616 216,639 2,212,830
Property and equipment additions
including accrued amounts 324,272 8,466 1,037 30,551 364,326