Cabela's 2009 Annual Report Download - page 82
Download and view the complete annual report
Please find page 82 of the 2009 Cabela's annual report below. You can navigate through the pages in the report by either clicking on the pages listed below, or by using the keyword search tool below to find specific information within the annual report.-
 1
1 -
2
-
3
-
4
-
5
-
6
-
7
-
8
-
9
-
10
-
11
-
12
-
13
-
14
-
15
-
16
-
17
-
18
-
19
-
20
-
21
-
22
-
23
-
24
-
25
-
26
-
27
-
28
-
29
-
30
-
31
-
32
-
33
-
34
-
35
-
36
-
37
-
38
-
39
-
40
-
41
-
42
-
43
-
44
-
45
-
46
-
47
-
48
-
49
-
50
-
51
-
52
-
53
-
54
-
55
-
56
-
57
-
58
-
59
-
60
-
61
-
62
-
63
-
64
-
65
-
66
-
67
-
68
-
69
-
70
-
71
-
 72
72 -
 73
73 -
 74
74 -
 75
75 -
 76
76 -
 77
77 -
 78
78 -
 79
79 -
 80
80 -
 81
81 -
 82
82 -
 83
83 -
 84
84 -
 85
85 -
 86
86 -
 87
87 -
 88
88 -
 89
89 -
 90
90 -
 91
91 -
 92
92 -
93
-
94
-
95
-
96
-
97
-
98
-
99
-
100
-
101
-
102
-
103
-
104
-
105
-
106
-
107
-
108
-
109
-
110
-
111
-
112
-
113
-
114
-
115
-
116
-
117
-
118
-
119
-
120
-
121
-
122
-
123
-
124
-
125
-
126
-
127
-
128
-
129
-
130
-
131
 |
 |

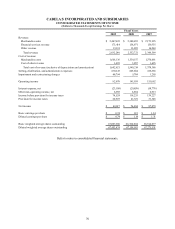
73
CABELA’S INCORPORATED AND SUBSIDIARIES
CONSOLIDATED STATEMENTS OF STOCKHOLDERS’ EQUITY
(Dollars in Thousands)
Common
Stock
Shares Common
Stock
Additional
Paid-In
Capital Retained
Earnings
Accumulated
Other
Comprehensive
Income (Loss) Total
BALANCE, beginning of 2007 65,363,736 $654 $247,741 $485,148 $315 $733,858
Cumulative effect adjustment to adopt ASC 740 - - - (1,755) - (1,755)
Comprehensive income:
Net income - - - 87,879 -87,879
Unrealized loss on economic development
bonds, net of taxes of $659 - - - - (1,098)(1,098)
Derivative adjustment, net of taxes of $32 - - - - 53 53
Foreign currency translation adjustment - - - - 7 7
Total comprehensive income 86,841
Stock based compensation - - 4,465 - - 4,465
Exercise of employee stock options 524,648 53,973 - - 3,978
Tax benefit on employee stock option exercises - - 1,172 - - 1,172
BALANCE, end of 2007 65,888,384 659 257,351 571,272 (723)828,559
Comprehensive income:
Net income - - - 76,404 -76,404
Unrealized loss on economic development
bonds, net of taxes of $3,200 - - - - (5,425)(5,425)
Derivative adjustment, net of taxes of $24 - - - - (43)(43)
Foreign currency translation adjustment - - - - (406)(406)
Total comprehensive income 70,530
Stock based compensation - - 6,058 - - 6,058
Employee stock purchase plan issuances 64,668 -513 - - 513
Issuance of restricted stock 111,324 1 - - - 1
Exercise of employee stock options 769,608 87,198 - - 7,206
Tax benefit on employee stock option exercises - - 838 - - 838
BALANCE, end of 2008 66,833,984 668 271,958 647,676 (6,597)913,705
Comprehensive income:
Net income - - - 49,617 -49,617
Unrealized gain on economic development
bonds, net of taxes of $2,487 - - - - 4,104 4,104
Unrealized gain on asset-backed available for
sale securities, net of taxes of $2,071 - - - - 3,650 3,650
Derivative adjustment, net of taxes of $7 - - - - (11)(11)
Foreign currency translation adjustment - - - - (181)(181)
Total comprehensive income 57,179
Stock based compensation - - 9,057 - - 9,057
Employee stock purchase plan issuances 217,707 32,250 - - 2,253
Exercise of employee stock options 235,884 22,091 - - 2,093
Tax benefit on employee stock option exercises - - 134 - - 134
BALANCE, end of 2009 67,287,575 $673 $285,490 $697,293 $965 $984,421
Refer to notes to consolidated financial statements.