Cabela's 2009 Annual Report Download - page 53
Download and view the complete annual report
Please find page 53 of the 2009 Cabela's annual report below. You can navigate through the pages in the report by either clicking on the pages listed below, or by using the keyword search tool below to find specific information within the annual report.-
 1
1 -
2
-
3
-
4
-
5
-
6
-
7
-
8
-
9
-
10
-
11
-
12
-
13
-
14
-
15
-
16
-
17
-
18
-
19
-
20
-
21
-
22
-
23
-
24
-
25
-
26
-
27
-
28
-
29
-
30
-
31
-
32
-
33
-
34
-
35
-
36
-
37
-
38
-
39
-
40
-
41
-
42
-
 43
43 -
 44
44 -
 45
45 -
 46
46 -
 47
47 -
 48
48 -
 49
49 -
 50
50 -
 51
51 -
 52
52 -
 53
53 -
 54
54 -
 55
55 -
 56
56 -
 57
57 -
 58
58 -
 59
59 -
 60
60 -
 61
61 -
 62
62 -
 63
63 -
64
-
65
-
66
-
67
-
68
-
69
-
70
-
71
-
72
-
73
-
74
-
75
-
76
-
77
-
78
-
79
-
80
-
81
-
82
-
83
-
84
-
85
-
86
-
87
-
88
-
89
-
90
-
91
-
92
-
93
-
94
-
95
-
96
-
97
-
98
-
99
-
100
-
101
-
102
-
103
-
104
-
105
-
106
-
107
-
108
-
109
-
110
-
111
-
112
-
113
-
114
-
115
-
116
-
117
-
118
-
119
-
120
-
121
-
122
-
123
-
124
-
125
-
126
-
127
-
128
-
129
-
130
-
131
 |
 |

44
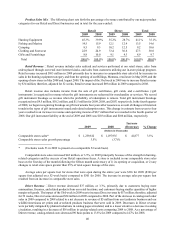
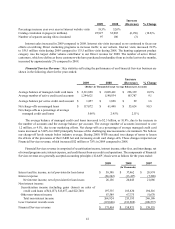
Accordingly, comparisons of gross margins on merchandising revenue presented below are the best metrics for
analysis of our gross profit for the years ended:
2009 2008 Increase
(Decrease) % Change
(Dollars in Thousands)
Merchandise sales $ 2,447,635 $2,380,655 $66,980 2.8%
Merchandise gross margin 846,499 841,498 5,001 0.6
Merchandise gross margin as a percentage of
merchandise revenue 34.6%35.3%(0.7)
Merchandise Gross Margin – The gross margin of our merchandising business increased $5 million, or
0.6%, to $847 million in 2009 compared to 2008. Our merchandise gross margin as a percentage of revenue of
our merchandising business decreased to 34.6% in 2009 from 35.3% in 2008. The merchandise gross margin for
2008 also includes the $8.7 million of gift instrument breakage previously described. Excluding this $8.7 million
of gift instrument breakage our merchandise gross margin for 2008 was 35.0%. The decrease in the merchandise
gross margin as a percentage of revenue for 2009 compared to 2008 is primarily attributable to a shift in customer
preference toward lower margin ammunition, firearms, and related products, management’s efforts to reduce
slow moving inventory, and the impact from higher 2009 merchandise sales compared to 2008. In 2008, we also
experienced margin pressure in certain hard goods categories due to increases in commodity prices.
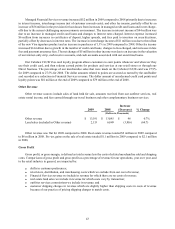
Selling, Distribution, and Administrative Expenses
2009 2008 Increase
(Decrease) % Change
(Dollars in Thousands)
Selling, distribution, and administrative expenses $ 870,147 $865,684 $4,463 0.5%
SD&A expenses as a percentage of total revenue 33.1%33.9%
Retail store pre-opening costs $ 3,694 $8,356 $(4,662)(55.8)%
Selling, distribution, and administrative expenses include all operating expenses related to our retail stores,
Internet website, distribution centers, product procurement, and overhead costs, including: advertising and
marketing, catalog costs, employee compensation and benefits, occupancy costs, information systems processing,
and depreciation and amortization.
Selling, distribution, and administrative expenses increased $4 million, or 0.5%, in 2009 (53 weeks) compared to
2008 (52 weeks). However, expressed as a percentage of total revenue, selling, distribution, and administrative expenses
improved 80 basis points to 33.1% in 2009 compared to 33.9% in 2008. The most significant factors contributing to
the changes in selling, distribution, and administrative expenses in 2009 compared to 2008 included:
• an increase in depreciation expense, and equipment and software costs of $16 million,
• an increase of $11 million in employee compensation and benefits primarily due to an increase in incentive
compensation of $12 million offset slightly by enhanced labor efficiencies in our Retail business,
• an increase of $3 million in professional fees,
• managed reductions in catalog-related costs resulting in a decrease in catalog and Internet marketing costs
of $16 million,
• improved efficiencies in advertising in our Retail and Direct businesses resulting in a decrease of $5
million in advertising and promotional costs, and
• a decrease in new store opening related reimbursements and miscellaneous costs of $5 million.