Cabela's 2009 Annual Report Download - page 114
Download and view the complete annual report
Please find page 114 of the 2009 Cabela's annual report below. You can navigate through the pages in the report by either clicking on the pages listed below, or by using the keyword search tool below to find specific information within the annual report.-
 1
1 -
2
-
3
-
4
-
5
-
6
-
7
-
8
-
9
-
10
-
11
-
12
-
13
-
14
-
15
-
16
-
17
-
18
-
19
-
20
-
21
-
22
-
23
-
24
-
25
-
26
-
27
-
28
-
29
-
30
-
31
-
32
-
33
-
34
-
35
-
36
-
37
-
38
-
39
-
40
-
41
-
42
-
43
-
44
-
45
-
46
-
47
-
48
-
49
-
50
-
51
-
52
-
53
-
54
-
55
-
56
-
57
-
58
-
59
-
60
-
61
-
62
-
63
-
64
-
65
-
66
-
67
-
68
-
69
-
70
-
71
-
72
-
73
-
74
-
75
-
76
-
77
-
78
-
79
-
80
-
81
-
82
-
83
-
84
-
85
-
86
-
87
-
88
-
89
-
90
-
91
-
92
-
93
-
94
-
95
-
96
-
97
-
98
-
99
-
100
-
101
-
102
-
103
-
 104
104 -
 105
105 -
 106
106 -
 107
107 -
 108
108 -
 109
109 -
 110
110 -
 111
111 -
 112
112 -
 113
113 -
 114
114 -
 115
115 -
 116
116 -
 117
117 -
 118
118 -
 119
119 -
 120
120 -
 121
121 -
 122
122 -
 123
123 -
 124
124 -
125
-
126
-
127
-
128
-
129
-
130
-
131
 |
 |

105
CABELA’S INCORPORATED AND SUBSIDIARIES
NOTES TO CONSOLIDATED FINANCIAL STATEMENTS
(Dollars in Thousands Except Share and Per Share Amounts)
820 and determined that at the end of 2009, all applicable financial instruments carried on our consolidated balance
sheets are classified as Level 3. The following table summarizes the valuation of our recurring financial instruments
at the years ended:
Fair Value at
Assets - Level 3: 2009 2008
Interest-only strip, cash reserve accounts, and cash accounts $ 24,577 $30,021
Asset-backed trading securities 68,752 31,584
Asset-backed available-for-sale securities 82,705 -
Economic development bonds 108,491 112,585
$284,525 $174,190
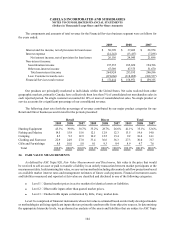
The table below presents changes in fair value of our assets measured at fair value on a recurring basis using
significant unobservable inputs (Level 3), as defined in ASC Topic 820, for the years ended 2009 and 2008:
Interest-Only
Strip, Cash
Reserve
Accounts, and
Cash Accounts
Asset-Backed
Trading
Securities
Asset-Backed
Available for
Sale Securities
Economic
Development
Bonds
Balance, December 29, 2007 $ 39,127 $12,650 $ - $ 98,035
Total gains or losses:
Included in earnings - realized (4,356) - - (42)
Included in accumulated other comprehensive
income - unrealized - - (8,584)
Purchases, issuances, and settlements, net (4,750)18,934 -23,176
Balance, December 27, 2008 30,021 31,584 -112,585
Total gains or losses:
Included in earnings - realized 2,556 -60 -
Included in accumulated other comprehensive
income - unrealized - - 5,721 6,592
Purchases, issuances, and settlements, net (8,000)37,168 76,924 (10,686)
Balance, January 2, 2010 $ 24,577 $68,752 $82,705 $108,491
Included in retained interests in securitized loans are interest-only strips, cash reserve accounts, and cash
accounts. For interest-only strips and cash reserve accounts WFB estimates related fair values based on the present
value of future expected cash flows using assumptions for credit losses, payment rates, finance charge yields, and
discount rates commensurate with the risks involved. For cash accounts, WFB estimates related fair values based
on the present value of future expected cash flows using discount rates commensurate with risks involved. WFB
retains the rights to remaining cash flows (including interchange fees) after the other costs of the Trust are paid.
However, future expected cash flows for valuation of the interest-only strips and cash reserve accounts do not include
interchange income since interchange income is earned only when a charge is made to a customer’s account.
WFB also owns asset-backed securities from its securitizations. Asset-backed trading securities fluctuate
daily based on the short-term operational needs of WFB. Advances and pay downs on the trading securities are at
par value. Therefore, the par value of the asset-backed trading securities approximates fair value. For asset-backed
available for sale securities, WFB estimates fair values using discounted cash flow projection estimates based upon
contractual principal and interest cash flows. The discount rate utilized is based upon management’s evaluation of