Cabela's 2009 Annual Report Download - page 97
Download and view the complete annual report
Please find page 97 of the 2009 Cabela's annual report below. You can navigate through the pages in the report by either clicking on the pages listed below, or by using the keyword search tool below to find specific information within the annual report.-
 1
1 -
2
-
3
-
4
-
5
-
6
-
7
-
8
-
9
-
10
-
11
-
12
-
13
-
14
-
15
-
16
-
17
-
18
-
19
-
20
-
21
-
22
-
23
-
24
-
25
-
26
-
27
-
28
-
29
-
30
-
31
-
32
-
33
-
34
-
35
-
36
-
37
-
38
-
39
-
40
-
41
-
42
-
43
-
44
-
45
-
46
-
47
-
48
-
49
-
50
-
51
-
52
-
53
-
54
-
55
-
56
-
57
-
58
-
59
-
60
-
61
-
62
-
63
-
64
-
65
-
66
-
67
-
68
-
69
-
70
-
71
-
72
-
73
-
74
-
75
-
76
-
77
-
78
-
79
-
80
-
81
-
82
-
83
-
84
-
85
-
86
-
 87
87 -
 88
88 -
 89
89 -
 90
90 -
 91
91 -
 92
92 -
 93
93 -
 94
94 -
 95
95 -
 96
96 -
 97
97 -
 98
98 -
 99
99 -
 100
100 -
 101
101 -
 102
102 -
 103
103 -
 104
104 -
 105
105 -
 106
106 -
 107
107 -
108
-
109
-
110
-
111
-
112
-
113
-
114
-
115
-
116
-
117
-
118
-
119
-
120
-
121
-
122
-
123
-
124
-
125
-
126
-
127
-
128
-
129
-
130
-
131
 |
 |

88
CABELA’S INCORPORATED AND SUBSIDIARIES
NOTES TO CONSOLIDATED FINANCIAL STATEMENTS
(Dollars in Thousands Except Share and Per Share Amounts)
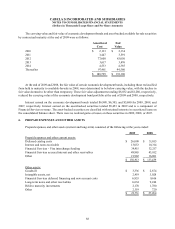
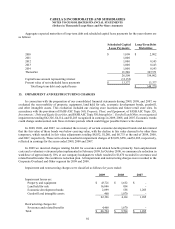
The carrying value and fair value of economic development bonds and asset-backed available for sale securities
by contractual maturity at the end of 2009 were as follows:
Amortized
Cost Fair
Value
2010 $2,133 $2,134
2011 3,447 3,591
2012 77,608 83,050
2013 3,617 3,476
2014 4,533 4,385
Thereafter 97,461 94,560
$188,799 $191,196
At the end of 2009 and 2008, the fair value of certain economic development bonds, including those reclassified
from held to maturity to available-for-sale in 2008, were determined to be below carrying value, with the decline in
fair value deemed to be other than temporary. These fair value adjustments totaling $8,032 and $1,280, respectively,
reduced the carrying value of the economic development bond portfolio at the end of 2009 and 2008, respectively.
Interest earned on the economic development bonds totaled $6,988, $6,305, and $5,680 for 2009, 2008, and
2007, respectively. Interest earned on the asset-backed securities totaled $5,453 in 2009 and is a component of
Financial Services revenue. The asset-backed securities are classified with retained interests in securitized loans on
the consolidated balance sheet. There were no realized gains or losses on these securities in 2009, 2008, or 2007.
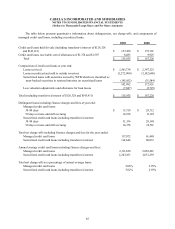
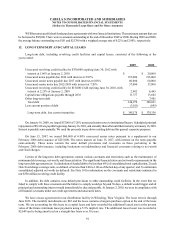
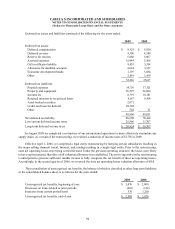
6. PREPAID EXPENSES AND OTHER ASSETS
Prepaid expenses and other assets (current and long-term) consisted of the following at the years ended:
2009 2008
Prepaid expenses and other current assets:
Deferred catalog costs $ 26,098 $31,015
Interest and notes receivable 13,053 10,314
Financial Services - Visa interchange funding 39,915 32,217
Financial Services accrued interest and other receivables 49,865 43,812
Other 21,982 16,081
$150,913 $133,439
Other assets:
Goodwill $ 3,336 $2,874
Intangible assets, net 2,419 3,028
Financial Services deferred financing and new account costs 6,853 9,616
Long-term notes and other receivables 6,634 9,246
Held to maturity investments 2,170 1,780
Other 2,319 720
$23,731 $27,264