Cabela's 2009 Annual Report Download - page 9
Download and view the complete annual report
Please find page 9 of the 2009 Cabela's annual report below. You can navigate through the pages in the report by either clicking on the pages listed below, or by using the keyword search tool below to find specific information within the annual report.-
 1
1 -
 2
2 -
 3
3 -
 4
4 -
 5
5 -
 6
6 -
 7
7 -
 8
8 -
 9
9 -
 10
10 -
 11
11 -
 12
12 -
 13
13 -
 14
14 -
 15
15 -
 16
16 -
 17
17 -
 18
18 -
 19
19 -
 20
20 -
21
-
22
-
23
-
24
-
25
-
26
-
27
-
28
-
29
-
30
-
31
-
32
-
33
-
34
-
35
-
36
-
37
-
38
-
39
-
40
-
41
-
42
-
43
-
44
-
45
-
46
-
47
-
48
-
49
-
50
-
51
-
52
-
53
-
54
-
55
-
56
-
57
-
58
-
59
-
60
-
61
-
62
-
63
-
64
-
65
-
66
-
67
-
68
-
69
-
70
-
71
-
72
-
73
-
74
-
75
-
76
-
77
-
78
-
79
-
80
-
81
-
82
-
83
-
84
-
85
-
86
-
87
-
88
-
89
-
90
-
91
-
92
-
93
-
94
-
95
-
96
-
97
-
98
-
99
-
100
-
101
-
102
-
103
-
104
-
105
-
106
-
107
-
108
-
109
-
110
-
111
-
112
-
113
-
114
-
115
-
116
-
117
-
118
-
119
-
120
-
121
-
122
-
123
-
124
-
125
-
126
-
127
-
128
-
129
-
130
-
131
 |
 |

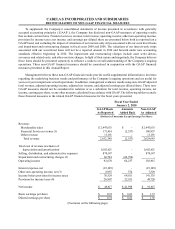
Return on invested capital (“ROIC”) is not a measure of financial performance under generally accepted
accounting principles (“GAAP”) and may not be defined and calculated by other companies in the same manner.
ROIC should be considered supplemental to and not a substitute for financial information prepared in accordance
with GAAP. The Company uses ROIC as a measure of efficiency and effectiveness of its use of capital.
The Company measures ROIC by dividing adjusted net income by average total capital. Adjusted net income is
calculated by adding interest expense, rent expense, and Retail segment depreciation and amortization (all after tax)
to reported net income excluding: (1) any losses on sales of assets, (2) any impairment charges or fixed asset write
downs, (3) any acceleration of depreciation charges caused by impairment of economic development bonds, and (4)
any changes in the allowance for loan losses at our Financial Services segment (“WFB”) (all after tax). Total capital
is calculated by adding current maturities of long-term debt, deferred compensation, operating leases capitalized at
eight times next year’s annual minimum lease payments, and total stockholders’ equity to long-term debt (excluding
long- and short-term time deposits held by WFB) and then subtracting cash and cash equivalents (excluding cash
and cash equivalents held by WFB). Average total capital is calculated as the sum of current and prior year ending
total capital divided by two. The following table reconciles the components of ROIC to the most comparable GAAP
financial measures.
Fiscal Year Ended
January 2, 2010 December 27, 2008 December 29, 2007
(Dollars in Thousands)
Net income $ 49,617 $76,404 $87,879
Add back:
Interest expense 23,223 29,708 20,243
Rent expense 8,624 8,494 9,792
Depreciation and amortization - Retail segment 41,822 37,930 29,830
Exclude:
Losses on sales of assets - - -
Impairment charges or fixed asset writedowns 60,227 3,694 -
Acceleration of depreciation charges from
impairment of economic development bonds 2,099 516 1,205
Changes in the allowance for loan losses - WFB 3,060 2,640 2,165
139,055 82,982 63,235
After tax effect 90,163 53,623 39,914
Effective tax rate 35.16%35.38%36.88%
Adjusted net income $ 139,780 $130,027 $127,793
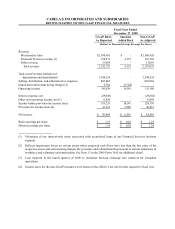
Total capital:
Current maturities of long-term debt $3,101 $695 $26,785
Deferred compensation 349 5,192 5,379
Operating leases capitalized at 8x next year’s
annual minimum lease payments 53,608 44,928 41,008
Total stockholders' equity 984,421 913,705 828,559
Long-term debt (excluding WFB time deposits) 345,178 379,336 476,600
1,386,657 1,343,856 1,378,331
Less:
Cash and cash equivalents (582,185)(410,104)(131,182)
Add back cash and cash equivalents at WFB 371,408 402,058 123,163
(210,777)(8,046)(8,019)
Adjusted total capital $ 1,175,880 $1,335,810 $1,370,312
Average total capital $1,255,845 $1,353,061 $1,173,928
Return on Invested Capital 11.1%9.6%10.9%
CABELA’S INCORPORATED AND SUBSIDIARIES
RETURN ON INVESTED CAPITAL