Cabela's 2009 Annual Report Download - page 52
Download and view the complete annual report
Please find page 52 of the 2009 Cabela's annual report below. You can navigate through the pages in the report by either clicking on the pages listed below, or by using the keyword search tool below to find specific information within the annual report.-
 1
1 -
2
-
3
-
4
-
5
-
6
-
7
-
8
-
9
-
10
-
11
-
12
-
13
-
14
-
15
-
16
-
17
-
18
-
19
-
20
-
21
-
22
-
23
-
24
-
25
-
26
-
27
-
28
-
29
-
30
-
31
-
32
-
33
-
34
-
35
-
36
-
37
-
38
-
39
-
40
-
41
-
 42
42 -
 43
43 -
 44
44 -
 45
45 -
 46
46 -
 47
47 -
 48
48 -
 49
49 -
 50
50 -
 51
51 -
 52
52 -
 53
53 -
 54
54 -
 55
55 -
 56
56 -
 57
57 -
 58
58 -
 59
59 -
 60
60 -
 61
61 -
 62
62 -
63
-
64
-
65
-
66
-
67
-
68
-
69
-
70
-
71
-
72
-
73
-
74
-
75
-
76
-
77
-
78
-
79
-
80
-
81
-
82
-
83
-
84
-
85
-
86
-
87
-
88
-
89
-
90
-
91
-
92
-
93
-
94
-
95
-
96
-
97
-
98
-
99
-
100
-
101
-
102
-
103
-
104
-
105
-
106
-
107
-
108
-
109
-
110
-
111
-
112
-
113
-
114
-
115
-
116
-
117
-
118
-
119
-
120
-
121
-
122
-
123
-
124
-
125
-
126
-
127
-
128
-
129
-
130
-
131
 |
 |

43
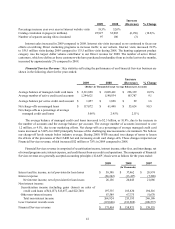
Managed Financial Services revenue increased $12 million in 2009 compared to 2008 primarily due to increases
in interest income, interchange income (net of customer rewards costs), and other fee income, partially offset by an
increase of $56 million in the provision for loan losses from increases in managed credit card loans and in net charge-
offs due to the current challenging macroeconomic environment. The increase in interest income of $44 million was
due to an increase in managed credit card loans and changes to interest rates charged. Interest expense increased
$6 million from increases in certificates of deposit, higher spreads, and fees paid to investors on securitizations,
partially offset by decreases in interest rates. The increase in interchange income of $11 million was due to the rollout
of the new Visa signature product and an increase in purchases of 1.3% in 2009 compared to 2008. Other fee income
increased $14 million due to growth in the number of credit card loans, changes to fees charged, and increases in late
fees and payment assurance fees. The net change of $5 million in other income was due to an increase in the valuation
of our interest-only strip, cash reserve accounts, and cash accounts associated with our securitized loans.
Our Cabela’s CLUB Visa card loyalty program allows customers to earn points whenever and wherever they
use their credit card, and then redeem earned points for products and services at our retail stores or through our
Direct business. The percentage of our merchandise sales that were made on the Cabela’s CLUB card was 27.9%
for 2009 compared to 27.5% for 2008. The dollar amounts related to points are accrued as earned by the cardholder
and recorded as a reduction in Financial Services revenue. The dollar amount of unredeemed credit card points and
loyalty points was $81 million at the end of 2009 compared to $79 million at the end of 2008.
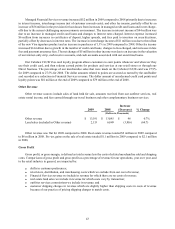
Other Revenue
Other revenue sources include sales of land held for sale, amounts received from our outfitter services, real
estate rental income, and fees earned through our travel business and other complementary business services.
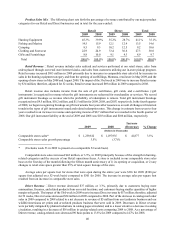
2009 2008 Increase
(Decrease) % Change
(Dollars in Thousands)
Other revenue $ 13,191 $13,095 $96 0.7%
Land sales (included in Other revenue) 2,133 6,049 (3,916)(64.7)
Other revenue was flat for 2009 compared to 2008. Real estate revenue totaled $2 million in 2009 compared
to $6 million in 2008. Pre-tax gains on the sale of real estate totaled $1.1 million in 2009 compared to $2.1 million
in 2008.
Gross Profit
Gross profit, or gross margin, is defined as total revenue less the costs of related merchandise sold and shipping
costs. Comparisons of gross profit and gross profit as a percentage of revenue for our operations, year over year, and
to the retail industry in general, are impacted by:
• shifts in customer preferences;
• retail store, distribution, and warehousing costs which we exclude from our cost of revenue;
• Financial Services revenue we include in revenue for which there are no costs of revenue;
• real estate land sales we include in revenue for which costs vary by transaction;
• outfitter services commissions we include in revenue; and
• customer shipping charges in revenue which are slightly higher than shipping costs in costs of revenue
because of our practice of pricing shipping charges to match costs.