Cabela's 2009 Annual Report Download - page 59
Download and view the complete annual report
Please find page 59 of the 2009 Cabela's annual report below. You can navigate through the pages in the report by either clicking on the pages listed below, or by using the keyword search tool below to find specific information within the annual report.-
 1
1 -
2
-
3
-
4
-
5
-
6
-
7
-
8
-
9
-
10
-
11
-
12
-
13
-
14
-
15
-
16
-
17
-
18
-
19
-
20
-
21
-
22
-
23
-
24
-
25
-
26
-
27
-
28
-
29
-
30
-
31
-
32
-
33
-
34
-
35
-
36
-
37
-
38
-
39
-
40
-
41
-
42
-
43
-
44
-
45
-
46
-
47
-
48
-
 49
49 -
 50
50 -
 51
51 -
 52
52 -
 53
53 -
 54
54 -
 55
55 -
 56
56 -
 57
57 -
 58
58 -
 59
59 -
 60
60 -
 61
61 -
 62
62 -
 63
63 -
 64
64 -
 65
65 -
 66
66 -
 67
67 -
 68
68 -
 69
69 -
70
-
71
-
72
-
73
-
74
-
75
-
76
-
77
-
78
-
79
-
80
-
81
-
82
-
83
-
84
-
85
-
86
-
87
-
88
-
89
-
90
-
91
-
92
-
93
-
94
-
95
-
96
-
97
-
98
-
99
-
100
-
101
-
102
-
103
-
104
-
105
-
106
-
107
-
108
-
109
-
110
-
111
-
112
-
113
-
114
-
115
-
116
-
117
-
118
-
119
-
120
-
121
-
122
-
123
-
124
-
125
-
126
-
127
-
128
-
129
-
130
-
131
 |
 |
50
Financial Services:
• A decrease in advertising and promotional costs of $6 million due to new marketing incentives received,
less new accounts, which were partially offset by increases in new account acquisition costs.
• A decrease of $5 million in the marketing fee paid by the Financial Services segment to the Direct business
segment ($4 million) and the Retail segment ($1 million).
• An increase in professional fees of $2 million from additional securitizations completed in 2008.
• An increase in third party processing fees of $1 million due to an increase in the volume of transactions.
• Postage cost increases of $1 million from increases in the number of accounts and additional mailings for
changes in terms.
Corporate Overhead, Distribution Centers, and Other:
• A decrease in depreciation expense of $3 million primarily related to longer estimated useful lives for
information system hardware and software in 2008 versus 2007.
• A decrease of $2 million in equipment and software expenses principally from less equipment and software
expenditures.
Impairment and Restructuring Charges
Impairment and restructuring charges totaling $6 million were recognized in 2008 compared to $1 million in
2007. In October 2008, we announced a reduction in workforce of approximately 10% at our company headquarters
which resulted in recording $2 million in severance and related benefits. We completed our annual impairment
analyses on goodwill and other intangible assets and recognized an impairment of $1 million. In addition, we
evaluated the recoverability of certain property and equipment and our available-for-sale economic development
bonds being actively marketed and recorded an impairment of $2 million as well as incurring prepayment penalties
of $1 million in the fourth quarter of 2008.
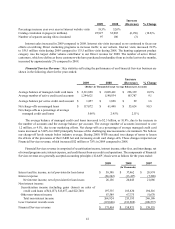
Operating Income
Operating income decreased $10 million, or 6.7%, in 2008 compared to 2007. Operating income as a percentage
of revenue also decreased to 5.5% in 2008 from 6.4% in 2007. The decrease in total operating income and total
operating income as a percentage of total revenue was primarily due to lower revenue from our Direct business
segment, lower merchandise gross margins, and the increases in selling, distribution, and administrative expenses
mostly for the addition of two new stores in 2008 and eight new stores in 2007, along with the addition of infrastructure
necessary to support this store expansion. The Financial Services segment incurs a marketing fee paid to the Retail
and Direct business segments which is included in selling, distribution, and administrative expenses as an expense for
the Financial Services segment and as a credit to expense for the Retail and Direct business segments. The marketing
fee paid by the Financial Services segment to these two business segments decreased $5 million in 2008 compared to
2007 – a $4 million decrease to the Direct business segment and a $1 million decrease to the Retail segment.
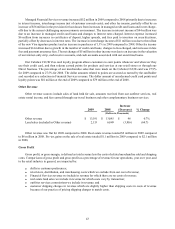
Interest (Expense) Income, Net
Interest expense, net of interest income, increased $11 million to $30 million in 2008 compared to 2007. The
net increase in interest expense was primarily due to additional debt incurred for financing our retail store expansion.
During 2008, we capitalized interest totaling $2 million on qualifying fixed assets relating primarily to retail store
construction compared to $4 million for 2007.
Other Non-Operating Income, Net
Other income was $7 million for both 2008 and 2007. This income is principally from the interest earned on
our economic development bonds. For 2007, other non-operating income also includes a pre-tax gain of $1 million
resulting from the sale of the assets of our hotel operation in Sidney, Nebraska.
Provision for Income Taxes
Our effective tax rate was 35.4% for 2008 compared to 36.9% for 2007. The effective tax rate was lower for
2008 compared to 2007 primarily due to the impact from a corporate restructure completed effective April 1, 2008,
and the release of a valuation allowance on state net operating losses.