Cabela's 2009 Annual Report Download - page 110
Download and view the complete annual report
Please find page 110 of the 2009 Cabela's annual report below. You can navigate through the pages in the report by either clicking on the pages listed below, or by using the keyword search tool below to find specific information within the annual report.-
 1
1 -
2
-
3
-
4
-
5
-
6
-
7
-
8
-
9
-
10
-
11
-
12
-
13
-
14
-
15
-
16
-
17
-
18
-
19
-
20
-
21
-
22
-
23
-
24
-
25
-
26
-
27
-
28
-
29
-
30
-
31
-
32
-
33
-
34
-
35
-
36
-
37
-
38
-
39
-
40
-
41
-
42
-
43
-
44
-
45
-
46
-
47
-
48
-
49
-
50
-
51
-
52
-
53
-
54
-
55
-
56
-
57
-
58
-
59
-
60
-
61
-
62
-
63
-
64
-
65
-
66
-
67
-
68
-
69
-
70
-
71
-
72
-
73
-
74
-
75
-
76
-
77
-
78
-
79
-
80
-
81
-
82
-
83
-
84
-
85
-
86
-
87
-
88
-
89
-
90
-
91
-
92
-
93
-
94
-
95
-
96
-
97
-
98
-
99
-
 100
100 -
 101
101 -
 102
102 -
 103
103 -
 104
104 -
 105
105 -
 106
106 -
 107
107 -
 108
108 -
 109
109 -
 110
110 -
 111
111 -
 112
112 -
 113
113 -
 114
114 -
 115
115 -
 116
116 -
 117
117 -
 118
118 -
 119
119 -
 120
120 -
121
-
122
-
123
-
124
-
125
-
126
-
127
-
128
-
129
-
130
-
131
 |
 |

101
CABELA’S INCORPORATED AND SUBSIDIARIES
NOTES TO CONSOLIDATED FINANCIAL STATEMENTS
(Dollars in Thousands Except Share and Per Share Amounts)
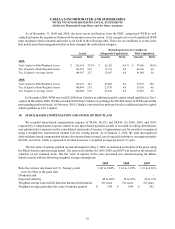
Retained Earnings – The most significant restrictions on the payment of dividends are the covenants contained
in our revolving credit agreement and unsecured senior notes purchase agreements. Nebraska banking laws also
govern the amount of dividends that WFB can pay to Cabela’s. At January 2, 2010, we had unrestricted retained
earnings of $84,770 available for dividends. However, we have never declared or paid any cash dividends on our
common stock and we do not anticipate paying any cash dividends in the foreseeable future.
Other Comprehensive Income (Loss) – The components of accumulated other comprehensive income (loss),
net of related taxes, are as follows for the years ended:
2009 2008
Accumulated net unrealized holding losses on economic development bonds $ (2,127) $ (6,231)
Accumulated net unrealized holding gains on derivatives 22 33
Accumulated net unrealized gain on asset-backed available-for-sale securities 3,650 -
Cumulative foreign currency translation adjustments (580)(399)
Total accumulated other comprehensive income (loss) $ 965 $(6,597)
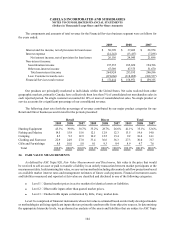
21. EARNINGS PER SHARE
The following table reconciles the number of shares utilized in the earnings per share calculations for the
years ended:
2009 2008 2007
Weighted average number of shares:
Common shares – basic 67,007,656 66,384,004 65,744,077
Effect of incremental dilutive securities:
Stock options, nonvested stock units, and
employee stock purchase plan shares 445,818 774,579 1,531,454
Common shares – diluted 67,453,474 67,158,583 67,275,531
Stock options outstanding and nonvested stock
units issued considered anti-dilutive 4,130,935 4,466,534 1,048,000
22. SUPPLEMENTAL CASH FLOW INFORMATION
The following table sets forth non-cash financing and investing activities and other cash flow information for
the years ended:
2009 2008 2007
Non-cash financing and investing activities:
Accrued property and equipment additions (1) $ 9,112 $12,304 $48,534
Capital lease obligations - - 201
Contribution of land received - 5,015 19,000
Issuance of restricted common stock - 1,167 -
Other cash flow information:
Interest paid $ 40,668 $42,575 $30,273
Capitalized interest (233)(2,472)(4,069)
Interest paid, net of capitalized interest $ 40,435 $40,103 $26,204
Income taxes, net $ 17,282 $55,594 $33,575
(1) Accrued property and equipment additions are recognized in the consolidated statements of cash flows in the
period they are paid.