Cabela's 2009 Annual Report Download - page 60
Download and view the complete annual report
Please find page 60 of the 2009 Cabela's annual report below. You can navigate through the pages in the report by either clicking on the pages listed below, or by using the keyword search tool below to find specific information within the annual report.-
 1
1 -
2
-
3
-
4
-
5
-
6
-
7
-
8
-
9
-
10
-
11
-
12
-
13
-
14
-
15
-
16
-
17
-
18
-
19
-
20
-
21
-
22
-
23
-
24
-
25
-
26
-
27
-
28
-
29
-
30
-
31
-
32
-
33
-
34
-
35
-
36
-
37
-
38
-
39
-
40
-
41
-
42
-
43
-
44
-
45
-
46
-
47
-
48
-
49
-
 50
50 -
 51
51 -
 52
52 -
 53
53 -
 54
54 -
 55
55 -
 56
56 -
 57
57 -
 58
58 -
 59
59 -
 60
60 -
 61
61 -
 62
62 -
 63
63 -
 64
64 -
 65
65 -
 66
66 -
 67
67 -
 68
68 -
 69
69 -
 70
70 -
71
-
72
-
73
-
74
-
75
-
76
-
77
-
78
-
79
-
80
-
81
-
82
-
83
-
84
-
85
-
86
-
87
-
88
-
89
-
90
-
91
-
92
-
93
-
94
-
95
-
96
-
97
-
98
-
99
-
100
-
101
-
102
-
103
-
104
-
105
-
106
-
107
-
108
-
109
-
110
-
111
-
112
-
113
-
114
-
115
-
116
-
117
-
118
-
119
-
120
-
121
-
122
-
123
-
124
-
125
-
126
-
127
-
128
-
129
-
130
-
131
 |
 |

51
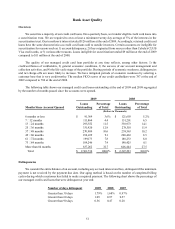
Bank Asset Quality
Overview
We securitize a majority of our credit card loans. On a quarterly basis, we transfer eligible credit card loans into
a securitization trust. We are required to own at least a minimum twenty day average of 5% of the interests in the
securitization trust. Our transferor’s interest totaled $126 million at the end of 2009. Accordingly, retained credit card
loans have the same characteristics as credit card loans sold to outside investors. Certain accounts are ineligible for
securitization for reasons such as: 1) account delinquency, 2) they originated from sources other than Cabela’s CLUB
Visa credit cards, or 3) various other reasons. Loans ineligible for securitization totaled $9 million at the end of 2009
compared to $11 million at the end of 2008.
The quality of our managed credit card loan portfolio at any time reflects, among other factors: 1) the
creditworthiness of cardholders, 2) general economic conditions, 3) the success of our account management and
collection activities, and 4) the life-cycle stage of the portfolio. During periods of economic weakness, delinquencies
and net charge-offs are more likely to increase. We have mitigated periods of economic weakness by selecting a
customer base that is very creditworthy. The median FICO scores of our credit cardholders were 787 at the end of
2009 compared to 786 at the end of 2008.
The following table shows our managed credit card loans outstanding at the end of 2009 and 2008 segregated
by the number of months passed since the accounts were opened.
2009 2008
Months Since Account Opened Loans
Outstanding Percentage
of Total Loans
Outstanding Percentage
of Total
(Dollars in Thousands)
6 months or less $ 91,369 3.6% $ 121,603 5.2%
7 – 12 months 111,864 4.4 151,201 6.5
13 – 24 months 295,552 11.5 330,973 14.1
25 – 36 months 331,920 12.9 278,318 11.9
37 – 48 months 270,909 10.6 239,563 10.2
49 – 60 months 234,439 9.1 200,463 8.5
61 – 72 months 199,173 7.8 188,233 8.0
73 – 84 months 189,246 7.4 190,425 8.1
More than 84 months 837,262 32.7 646,444 27.5
Total $2,561,734 100.0% $ 2,347,223 100.0%
Delinquencies
We consider the entire balance of an account, including any accrued interest and fees, delinquent if the minimum
payment is not received by the payment due date. Our aging method is based on the number of completed billing
cycles during which a customer has failed to make a required payment. The following chart shows the percentage of
our managed credit card loans that were delinquent at year end:
Number of days delinquent 2009 2008 2007
Greater than 30 days 1.79%1.68%0.97%
Greater than 60 days 1.09 0.97 0.57
Greater than 90 days 0.56 0.47 0.28